Guatemalan vs Immigrants from Netherlands Median Earnings
COMPARE
Guatemalan
Immigrants from Netherlands
Median Earnings
Median Earnings Comparison
Guatemalans
Immigrants from Netherlands
$41,205
MEDIAN EARNINGS
0.1/ 100
METRIC RATING
297th/ 347
METRIC RANK
$50,818
MEDIAN EARNINGS
99.8/ 100
METRIC RATING
73rd/ 347
METRIC RANK
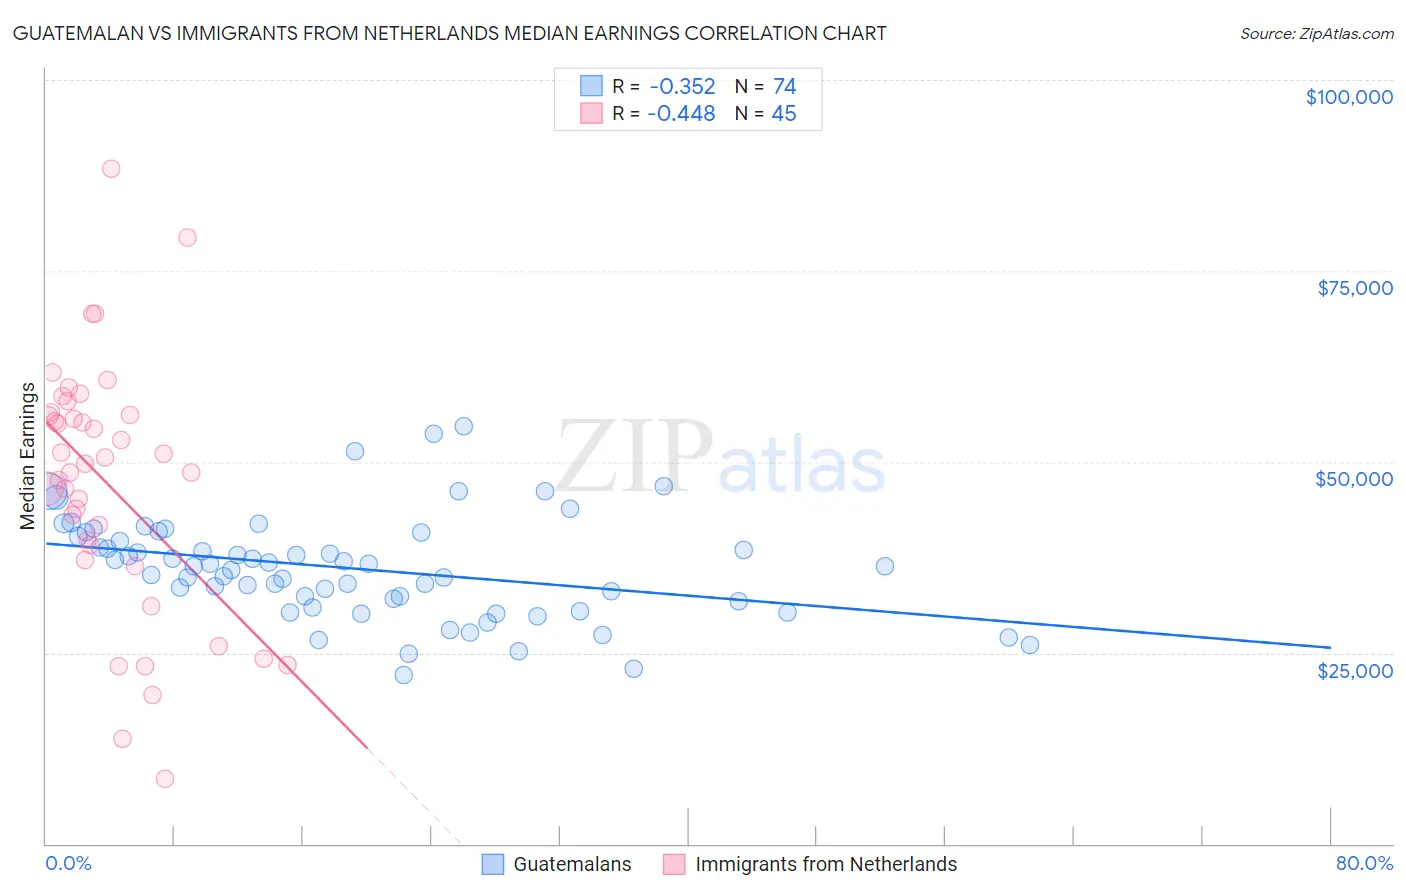
Guatemalan vs Immigrants from Netherlands Median Earnings Correlation Chart
The statistical analysis conducted on geographies consisting of 409,559,083 people shows a mild negative correlation between the proportion of Guatemalans and median earnings in the United States with a correlation coefficient (R) of -0.352 and weighted average of $41,205. Similarly, the statistical analysis conducted on geographies consisting of 237,873,103 people shows a moderate negative correlation between the proportion of Immigrants from Netherlands and median earnings in the United States with a correlation coefficient (R) of -0.448 and weighted average of $50,818, a difference of 23.3%.
Median Earnings Correlation Summary
| Measurement | Guatemalan | Immigrants from Netherlands |
| Minimum | $22,174 | $8,447 |
| Maximum | $54,583 | $88,336 |
| Range | $32,409 | $79,889 |
| Mean | $36,063 | $47,130 |
| Median | $36,315 | $49,796 |
| Interquartile 25% (IQ1) | $31,673 | $38,138 |
| Interquartile 75% (IQ3) | $40,213 | $56,269 |
| Interquartile Range (IQR) | $8,540 | $18,130 |
| Standard Deviation (Sample) | $6,708 | $16,545 |
| Standard Deviation (Population) | $6,663 | $16,360 |
Similar Demographics by Median Earnings
Demographics Similar to Guatemalans by Median Earnings
In terms of median earnings, the demographic groups most similar to Guatemalans are Cherokee ($41,252, a difference of 0.11%), Bangladeshi ($41,263, a difference of 0.14%), Immigrants from Micronesia ($41,133, a difference of 0.17%), Potawatomi ($41,288, a difference of 0.20%), and Immigrants from Caribbean ($41,119, a difference of 0.21%).
| Demographics | Rating | Rank | Median Earnings |
| Paiute | 0.1 /100 | #290 | Tragic $41,508 |
| Central American Indians | 0.1 /100 | #291 | Tragic $41,474 |
| U.S. Virgin Islanders | 0.1 /100 | #292 | Tragic $41,448 |
| Immigrants | Zaire | 0.1 /100 | #293 | Tragic $41,325 |
| Potawatomi | 0.1 /100 | #294 | Tragic $41,288 |
| Bangladeshis | 0.1 /100 | #295 | Tragic $41,263 |
| Cherokee | 0.1 /100 | #296 | Tragic $41,252 |
| Guatemalans | 0.1 /100 | #297 | Tragic $41,205 |
| Immigrants | Micronesia | 0.1 /100 | #298 | Tragic $41,133 |
| Immigrants | Caribbean | 0.1 /100 | #299 | Tragic $41,119 |
| Ute | 0.1 /100 | #300 | Tragic $41,051 |
| Immigrants | Latin America | 0.1 /100 | #301 | Tragic $41,049 |
| Shoshone | 0.0 /100 | #302 | Tragic $40,932 |
| Haitians | 0.0 /100 | #303 | Tragic $40,918 |
| Immigrants | Guatemala | 0.0 /100 | #304 | Tragic $40,851 |
Demographics Similar to Immigrants from Netherlands by Median Earnings
In terms of median earnings, the demographic groups most similar to Immigrants from Netherlands are South African ($50,752, a difference of 0.13%), Immigrants from Scotland ($50,741, a difference of 0.15%), Immigrants from Egypt ($50,901, a difference of 0.16%), Immigrants from Ukraine ($50,984, a difference of 0.33%), and Lithuanian ($50,991, a difference of 0.34%).
| Demographics | Rating | Rank | Median Earnings |
| Afghans | 99.9 /100 | #66 | Exceptional $51,112 |
| Immigrants | Spain | 99.9 /100 | #67 | Exceptional $51,092 |
| Paraguayans | 99.9 /100 | #68 | Exceptional $51,068 |
| Mongolians | 99.8 /100 | #69 | Exceptional $51,038 |
| Lithuanians | 99.8 /100 | #70 | Exceptional $50,991 |
| Immigrants | Ukraine | 99.8 /100 | #71 | Exceptional $50,984 |
| Immigrants | Egypt | 99.8 /100 | #72 | Exceptional $50,901 |
| Immigrants | Netherlands | 99.8 /100 | #73 | Exceptional $50,818 |
| South Africans | 99.8 /100 | #74 | Exceptional $50,752 |
| Immigrants | Scotland | 99.8 /100 | #75 | Exceptional $50,741 |
| Immigrants | Italy | 99.7 /100 | #76 | Exceptional $50,581 |
| Immigrants | Western Europe | 99.7 /100 | #77 | Exceptional $50,549 |
| Argentineans | 99.6 /100 | #78 | Exceptional $50,399 |
| Laotians | 99.6 /100 | #79 | Exceptional $50,343 |
| Ukrainians | 99.6 /100 | #80 | Exceptional $50,320 |