Guatemalan vs Immigrants from Switzerland Median Earnings
COMPARE
Guatemalan
Immigrants from Switzerland
Median Earnings
Median Earnings Comparison
Guatemalans
Immigrants from Switzerland
$41,205
MEDIAN EARNINGS
0.1/ 100
METRIC RATING
297th/ 347
METRIC RANK
$53,211
MEDIAN EARNINGS
100.0/ 100
METRIC RATING
35th/ 347
METRIC RANK
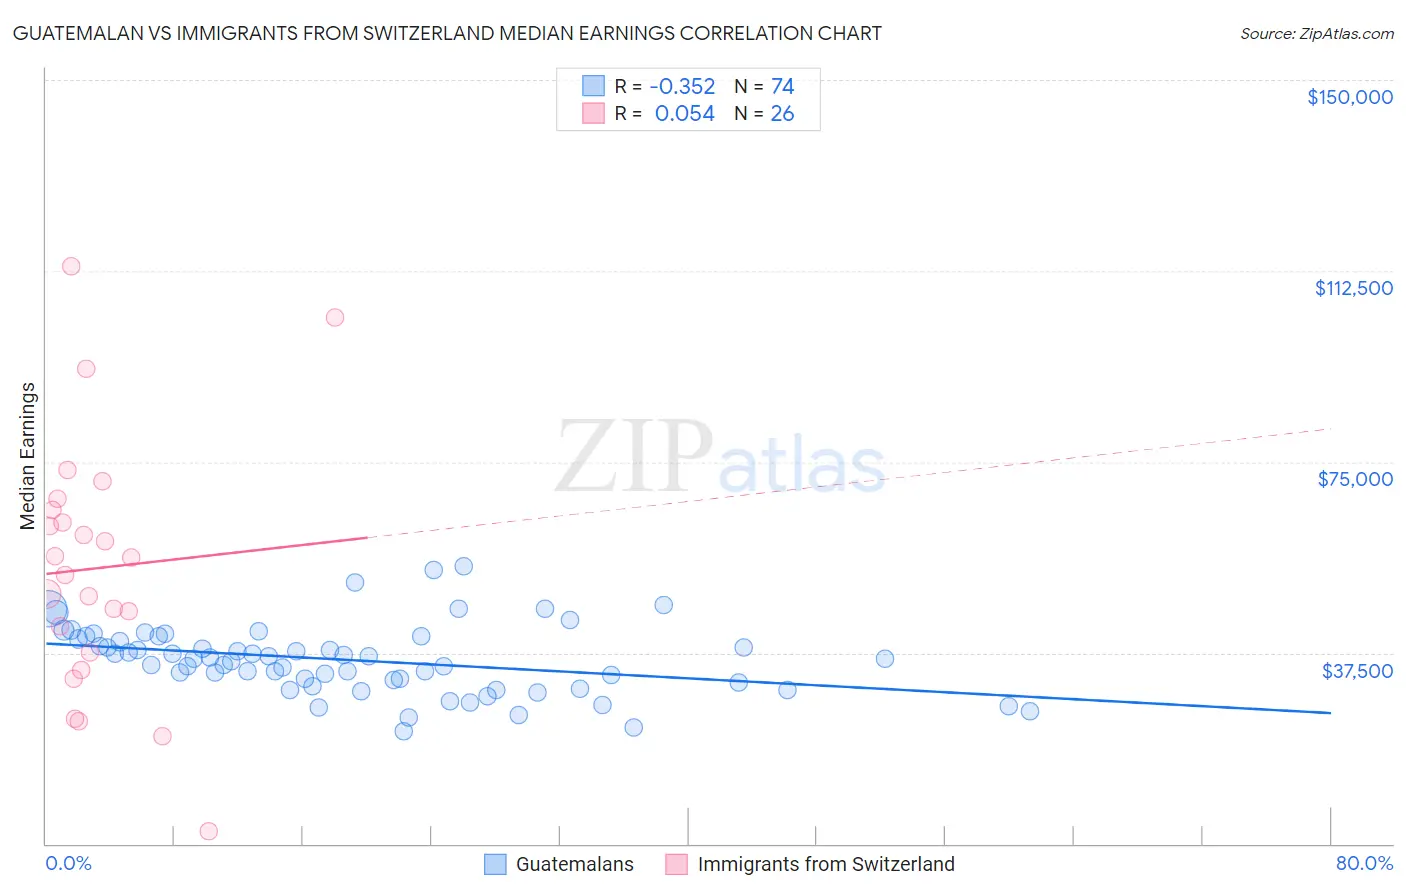
Guatemalan vs Immigrants from Switzerland Median Earnings Correlation Chart
The statistical analysis conducted on geographies consisting of 409,559,083 people shows a mild negative correlation between the proportion of Guatemalans and median earnings in the United States with a correlation coefficient (R) of -0.352 and weighted average of $41,205. Similarly, the statistical analysis conducted on geographies consisting of 148,076,857 people shows a slight positive correlation between the proportion of Immigrants from Switzerland and median earnings in the United States with a correlation coefficient (R) of 0.054 and weighted average of $53,211, a difference of 29.1%.
Median Earnings Correlation Summary
| Measurement | Guatemalan | Immigrants from Switzerland |
| Minimum | $22,174 | $2,499 |
| Maximum | $54,583 | $113,419 |
| Range | $32,409 | $110,920 |
| Mean | $36,063 | $54,118 |
| Median | $36,315 | $54,480 |
| Interquartile 25% (IQ1) | $31,673 | $37,656 |
| Interquartile 75% (IQ3) | $40,213 | $65,606 |
| Interquartile Range (IQR) | $8,540 | $27,950 |
| Standard Deviation (Sample) | $6,708 | $25,059 |
| Standard Deviation (Population) | $6,663 | $24,573 |
Similar Demographics by Median Earnings
Demographics Similar to Guatemalans by Median Earnings
In terms of median earnings, the demographic groups most similar to Guatemalans are Cherokee ($41,252, a difference of 0.11%), Bangladeshi ($41,263, a difference of 0.14%), Immigrants from Micronesia ($41,133, a difference of 0.17%), Potawatomi ($41,288, a difference of 0.20%), and Immigrants from Caribbean ($41,119, a difference of 0.21%).
| Demographics | Rating | Rank | Median Earnings |
| Paiute | 0.1 /100 | #290 | Tragic $41,508 |
| Central American Indians | 0.1 /100 | #291 | Tragic $41,474 |
| U.S. Virgin Islanders | 0.1 /100 | #292 | Tragic $41,448 |
| Immigrants | Zaire | 0.1 /100 | #293 | Tragic $41,325 |
| Potawatomi | 0.1 /100 | #294 | Tragic $41,288 |
| Bangladeshis | 0.1 /100 | #295 | Tragic $41,263 |
| Cherokee | 0.1 /100 | #296 | Tragic $41,252 |
| Guatemalans | 0.1 /100 | #297 | Tragic $41,205 |
| Immigrants | Micronesia | 0.1 /100 | #298 | Tragic $41,133 |
| Immigrants | Caribbean | 0.1 /100 | #299 | Tragic $41,119 |
| Ute | 0.1 /100 | #300 | Tragic $41,051 |
| Immigrants | Latin America | 0.1 /100 | #301 | Tragic $41,049 |
| Shoshone | 0.0 /100 | #302 | Tragic $40,932 |
| Haitians | 0.0 /100 | #303 | Tragic $40,918 |
| Immigrants | Guatemala | 0.0 /100 | #304 | Tragic $40,851 |
Demographics Similar to Immigrants from Switzerland by Median Earnings
In terms of median earnings, the demographic groups most similar to Immigrants from Switzerland are Immigrants from Denmark ($53,186, a difference of 0.050%), Immigrants from Sri Lanka ($53,268, a difference of 0.11%), Immigrants from Greece ($53,282, a difference of 0.13%), Immigrants from Asia ($53,310, a difference of 0.19%), and Russian ($53,334, a difference of 0.23%).
| Demographics | Rating | Rank | Median Earnings |
| Immigrants | France | 100.0 /100 | #28 | Exceptional $53,490 |
| Immigrants | Russia | 100.0 /100 | #29 | Exceptional $53,457 |
| Cambodians | 100.0 /100 | #30 | Exceptional $53,386 |
| Russians | 100.0 /100 | #31 | Exceptional $53,334 |
| Immigrants | Asia | 100.0 /100 | #32 | Exceptional $53,310 |
| Immigrants | Greece | 100.0 /100 | #33 | Exceptional $53,282 |
| Immigrants | Sri Lanka | 100.0 /100 | #34 | Exceptional $53,268 |
| Immigrants | Switzerland | 100.0 /100 | #35 | Exceptional $53,211 |
| Immigrants | Denmark | 100.0 /100 | #36 | Exceptional $53,186 |
| Immigrants | Belarus | 100.0 /100 | #37 | Exceptional $53,043 |
| Latvians | 100.0 /100 | #38 | Exceptional $53,001 |
| Immigrants | Turkey | 100.0 /100 | #39 | Exceptional $52,960 |
| Israelis | 100.0 /100 | #40 | Exceptional $52,937 |
| Immigrants | Lithuania | 100.0 /100 | #41 | Exceptional $52,769 |
| Maltese | 100.0 /100 | #42 | Exceptional $52,526 |