Guatemalan vs Immigrants from Senegal Hearing Disability
COMPARE
Guatemalan
Immigrants from Senegal
Hearing Disability
Hearing Disability Comparison
Guatemalans
Immigrants from Senegal
2.8%
HEARING DISABILITY
93.2/ 100
METRIC RATING
108th/ 347
METRIC RANK
2.6%
HEARING DISABILITY
99.7/ 100
METRIC RATING
26th/ 347
METRIC RANK
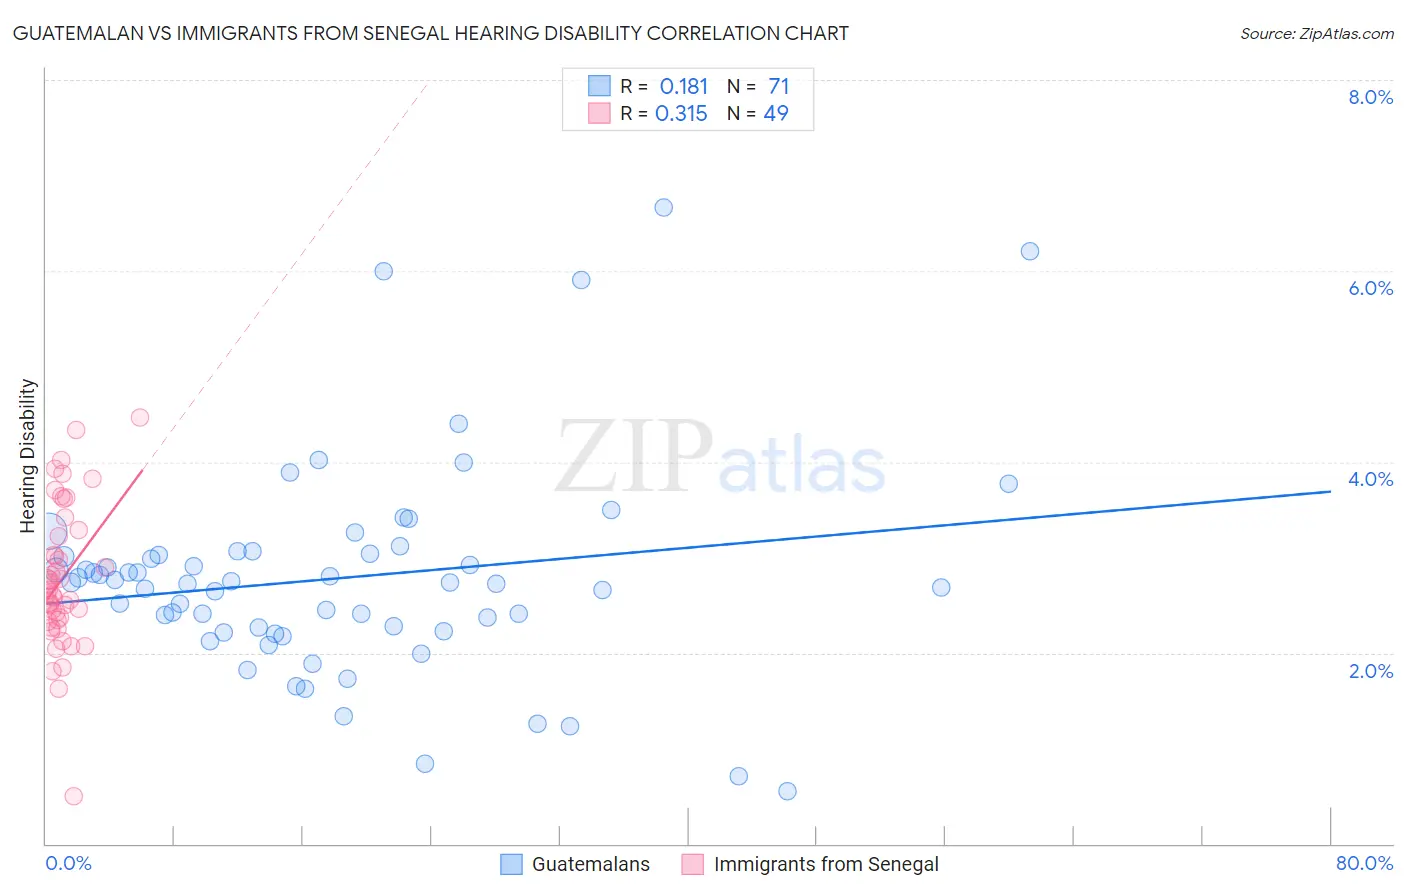
Guatemalan vs Immigrants from Senegal Hearing Disability Correlation Chart
The statistical analysis conducted on geographies consisting of 409,374,057 people shows a poor positive correlation between the proportion of Guatemalans and percentage of population with hearing disability in the United States with a correlation coefficient (R) of 0.181 and weighted average of 2.8%. Similarly, the statistical analysis conducted on geographies consisting of 90,120,921 people shows a mild positive correlation between the proportion of Immigrants from Senegal and percentage of population with hearing disability in the United States with a correlation coefficient (R) of 0.315 and weighted average of 2.6%, a difference of 8.9%.
Hearing Disability Correlation Summary
| Measurement | Guatemalan | Immigrants from Senegal |
| Minimum | 0.55% | 0.50% |
| Maximum | 6.7% | 4.5% |
| Range | 6.1% | 4.0% |
| Mean | 2.8% | 2.8% |
| Median | 2.7% | 2.6% |
| Interquartile 25% (IQ1) | 2.2% | 2.3% |
| Interquartile 75% (IQ3) | 3.0% | 3.3% |
| Interquartile Range (IQR) | 0.81% | 0.92% |
| Standard Deviation (Sample) | 1.1% | 0.75% |
| Standard Deviation (Population) | 1.1% | 0.74% |
Similar Demographics by Hearing Disability
Demographics Similar to Guatemalans by Hearing Disability
In terms of hearing disability, the demographic groups most similar to Guatemalans are Turkish (2.8%, a difference of 0.070%), Honduran (2.8%, a difference of 0.080%), Immigrants from Chile (2.8%, a difference of 0.080%), Cypriot (2.8%, a difference of 0.12%), and Immigrants from Yemen (2.8%, a difference of 0.17%).
| Demographics | Rating | Rank | Hearing Disability |
| Immigrants | Spain | 94.9 /100 | #101 | Exceptional 2.8% |
| Taiwanese | 94.8 /100 | #102 | Exceptional 2.8% |
| Immigrants | Indonesia | 94.7 /100 | #103 | Exceptional 2.8% |
| Burmese | 94.2 /100 | #104 | Exceptional 2.8% |
| Moroccans | 93.9 /100 | #105 | Exceptional 2.8% |
| Hondurans | 93.4 /100 | #106 | Exceptional 2.8% |
| Immigrants | Chile | 93.4 /100 | #107 | Exceptional 2.8% |
| Guatemalans | 93.2 /100 | #108 | Exceptional 2.8% |
| Turks | 93.0 /100 | #109 | Exceptional 2.8% |
| Cypriots | 92.9 /100 | #110 | Exceptional 2.8% |
| Immigrants | Yemen | 92.7 /100 | #111 | Exceptional 2.8% |
| U.S. Virgin Islanders | 92.5 /100 | #112 | Exceptional 2.8% |
| Immigrants | Belarus | 91.6 /100 | #113 | Exceptional 2.8% |
| Cambodians | 91.1 /100 | #114 | Exceptional 2.8% |
| Immigrants | Latin America | 90.5 /100 | #115 | Exceptional 2.8% |
Demographics Similar to Immigrants from Senegal by Hearing Disability
In terms of hearing disability, the demographic groups most similar to Immigrants from Senegal are Immigrants from El Salvador (2.6%, a difference of 0.010%), Immigrants from South Central Asia (2.6%, a difference of 0.040%), Immigrants from Ghana (2.6%, a difference of 0.41%), Immigrants from Haiti (2.6%, a difference of 0.41%), and Bolivian (2.6%, a difference of 0.43%).
| Demographics | Rating | Rank | Hearing Disability |
| Thais | 99.8 /100 | #19 | Exceptional 2.5% |
| Immigrants | Bolivia | 99.8 /100 | #20 | Exceptional 2.5% |
| Ghanaians | 99.8 /100 | #21 | Exceptional 2.5% |
| Immigrants | Sierra Leone | 99.8 /100 | #22 | Exceptional 2.6% |
| Immigrants | Nigeria | 99.8 /100 | #23 | Exceptional 2.6% |
| Immigrants | Ghana | 99.8 /100 | #24 | Exceptional 2.6% |
| Immigrants | El Salvador | 99.7 /100 | #25 | Exceptional 2.6% |
| Immigrants | Senegal | 99.7 /100 | #26 | Exceptional 2.6% |
| Immigrants | South Central Asia | 99.7 /100 | #27 | Exceptional 2.6% |
| Immigrants | Haiti | 99.7 /100 | #28 | Exceptional 2.6% |
| Bolivians | 99.7 /100 | #29 | Exceptional 2.6% |
| Immigrants | Caribbean | 99.7 /100 | #30 | Exceptional 2.6% |
| Immigrants | Cameroon | 99.7 /100 | #31 | Exceptional 2.6% |
| Immigrants | Venezuela | 99.7 /100 | #32 | Exceptional 2.6% |
| Filipinos | 99.6 /100 | #33 | Exceptional 2.6% |