Swedish vs Immigrants from Senegal Median Earnings
COMPARE
Swedish
Immigrants from Senegal
Median Earnings
Median Earnings Comparison
Swedes
Immigrants from Senegal
$47,851
MEDIAN EARNINGS
88.0/ 100
METRIC RATING
143rd/ 347
METRIC RANK
$45,611
MEDIAN EARNINGS
24.0/ 100
METRIC RATING
207th/ 347
METRIC RANK
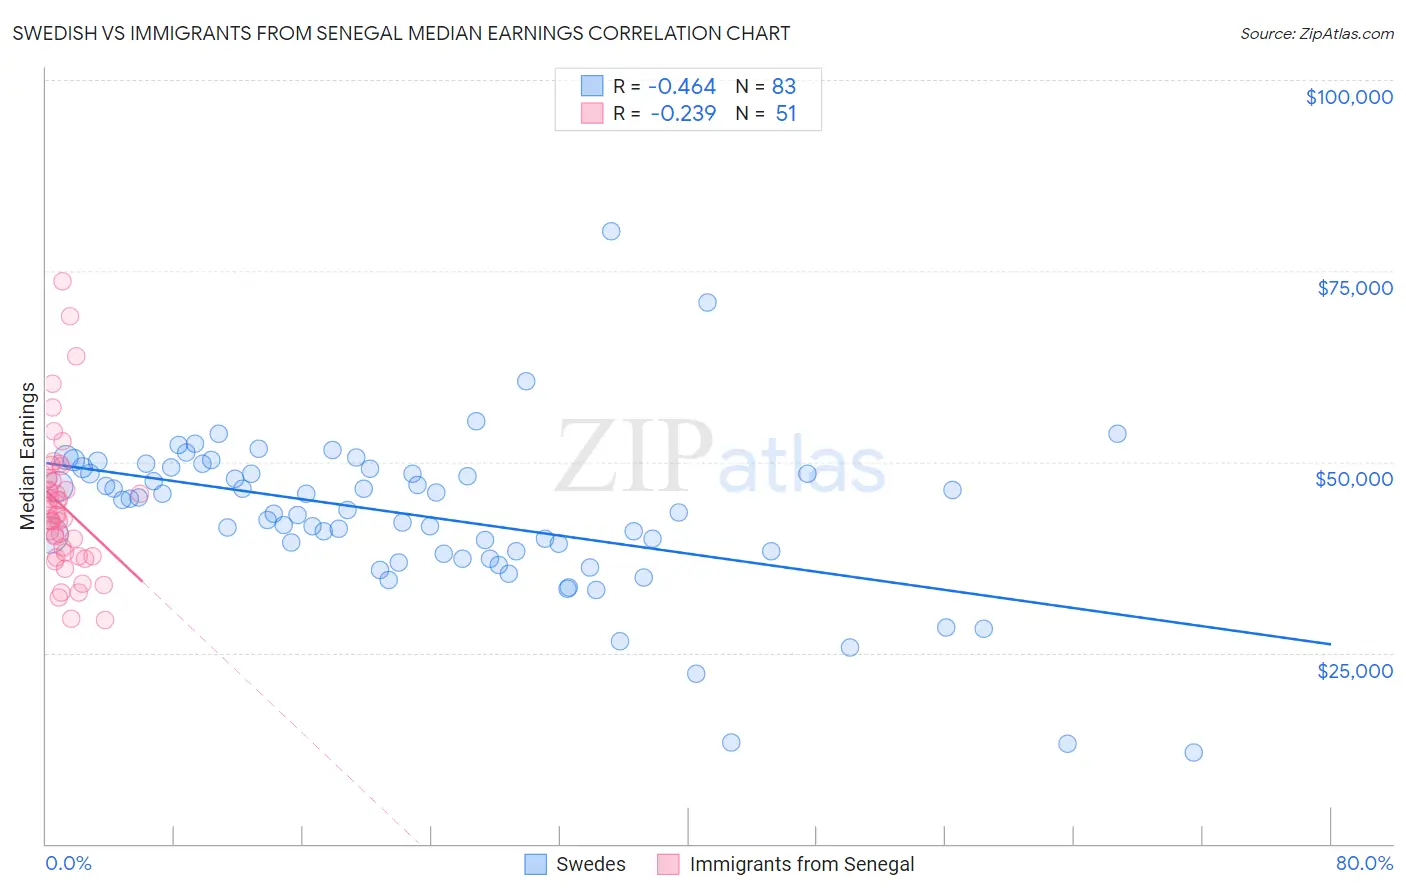
Swedish vs Immigrants from Senegal Median Earnings Correlation Chart
The statistical analysis conducted on geographies consisting of 538,996,314 people shows a moderate negative correlation between the proportion of Swedes and median earnings in the United States with a correlation coefficient (R) of -0.464 and weighted average of $47,851. Similarly, the statistical analysis conducted on geographies consisting of 90,128,045 people shows a weak negative correlation between the proportion of Immigrants from Senegal and median earnings in the United States with a correlation coefficient (R) of -0.239 and weighted average of $45,611, a difference of 4.9%.
Median Earnings Correlation Summary
| Measurement | Swedish | Immigrants from Senegal |
| Minimum | $11,875 | $29,284 |
| Maximum | $80,254 | $73,618 |
| Range | $68,379 | $44,334 |
| Mean | $42,935 | $44,131 |
| Median | $43,757 | $43,043 |
| Interquartile 25% (IQ1) | $37,994 | $37,628 |
| Interquartile 75% (IQ3) | $49,030 | $47,719 |
| Interquartile Range (IQR) | $11,035 | $10,091 |
| Standard Deviation (Sample) | $10,532 | $9,098 |
| Standard Deviation (Population) | $10,468 | $9,008 |
Similar Demographics by Median Earnings
Demographics Similar to Swedes by Median Earnings
In terms of median earnings, the demographic groups most similar to Swedes are Ugandan ($47,854, a difference of 0.010%), Immigrants from Sierra Leone ($47,875, a difference of 0.050%), Taiwanese ($47,902, a difference of 0.11%), Hungarian ($47,795, a difference of 0.12%), and European ($47,915, a difference of 0.13%).
| Demographics | Rating | Rank | Median Earnings |
| Slovenes | 90.0 /100 | #136 | Excellent $47,995 |
| Immigrants | Nepal | 89.0 /100 | #137 | Excellent $47,925 |
| Europeans | 88.9 /100 | #138 | Excellent $47,915 |
| Canadians | 88.8 /100 | #139 | Excellent $47,911 |
| Taiwanese | 88.7 /100 | #140 | Excellent $47,902 |
| Immigrants | Sierra Leone | 88.3 /100 | #141 | Excellent $47,875 |
| Ugandans | 88.0 /100 | #142 | Excellent $47,854 |
| Swedes | 88.0 /100 | #143 | Excellent $47,851 |
| Hungarians | 87.1 /100 | #144 | Excellent $47,795 |
| Immigrants | Saudi Arabia | 85.6 /100 | #145 | Excellent $47,704 |
| Immigrants | Chile | 85.5 /100 | #146 | Excellent $47,697 |
| Immigrants | South Eastern Asia | 85.0 /100 | #147 | Excellent $47,671 |
| Immigrants | Eritrea | 84.8 /100 | #148 | Excellent $47,657 |
| Luxembourgers | 84.5 /100 | #149 | Excellent $47,640 |
| Peruvians | 84.2 /100 | #150 | Excellent $47,628 |
Demographics Similar to Immigrants from Senegal by Median Earnings
In terms of median earnings, the demographic groups most similar to Immigrants from Senegal are Immigrants from Bosnia and Herzegovina ($45,600, a difference of 0.020%), Immigrants from Thailand ($45,598, a difference of 0.030%), Immigrants from Grenada ($45,596, a difference of 0.030%), Panamanian ($45,593, a difference of 0.040%), and Bermudan ($45,593, a difference of 0.040%).
| Demographics | Rating | Rank | Median Earnings |
| Immigrants | Azores | 29.5 /100 | #200 | Fair $45,812 |
| Celtics | 27.2 /100 | #201 | Fair $45,732 |
| Immigrants | Trinidad and Tobago | 27.1 /100 | #202 | Fair $45,729 |
| Welsh | 26.6 /100 | #203 | Fair $45,710 |
| Immigrants | Uruguay | 25.9 /100 | #204 | Fair $45,682 |
| Tongans | 25.4 /100 | #205 | Fair $45,665 |
| Immigrants | Ghana | 24.8 /100 | #206 | Fair $45,641 |
| Immigrants | Senegal | 24.0 /100 | #207 | Fair $45,611 |
| Immigrants | Bosnia and Herzegovina | 23.7 /100 | #208 | Fair $45,600 |
| Immigrants | Thailand | 23.7 /100 | #209 | Fair $45,598 |
| Immigrants | Grenada | 23.6 /100 | #210 | Fair $45,596 |
| Panamanians | 23.5 /100 | #211 | Fair $45,593 |
| Bermudans | 23.5 /100 | #212 | Fair $45,593 |
| Immigrants | Colombia | 22.4 /100 | #213 | Fair $45,550 |
| Nigerians | 22.0 /100 | #214 | Fair $45,532 |