Immigrants from Singapore vs Immigrants from Senegal Median Earnings
COMPARE
Immigrants from Singapore
Immigrants from Senegal
Median Earnings
Median Earnings Comparison
Immigrants from Singapore
Immigrants from Senegal
$59,038
MEDIAN EARNINGS
100.0/ 100
METRIC RATING
6th/ 347
METRIC RANK
$45,611
MEDIAN EARNINGS
24.0/ 100
METRIC RATING
207th/ 347
METRIC RANK
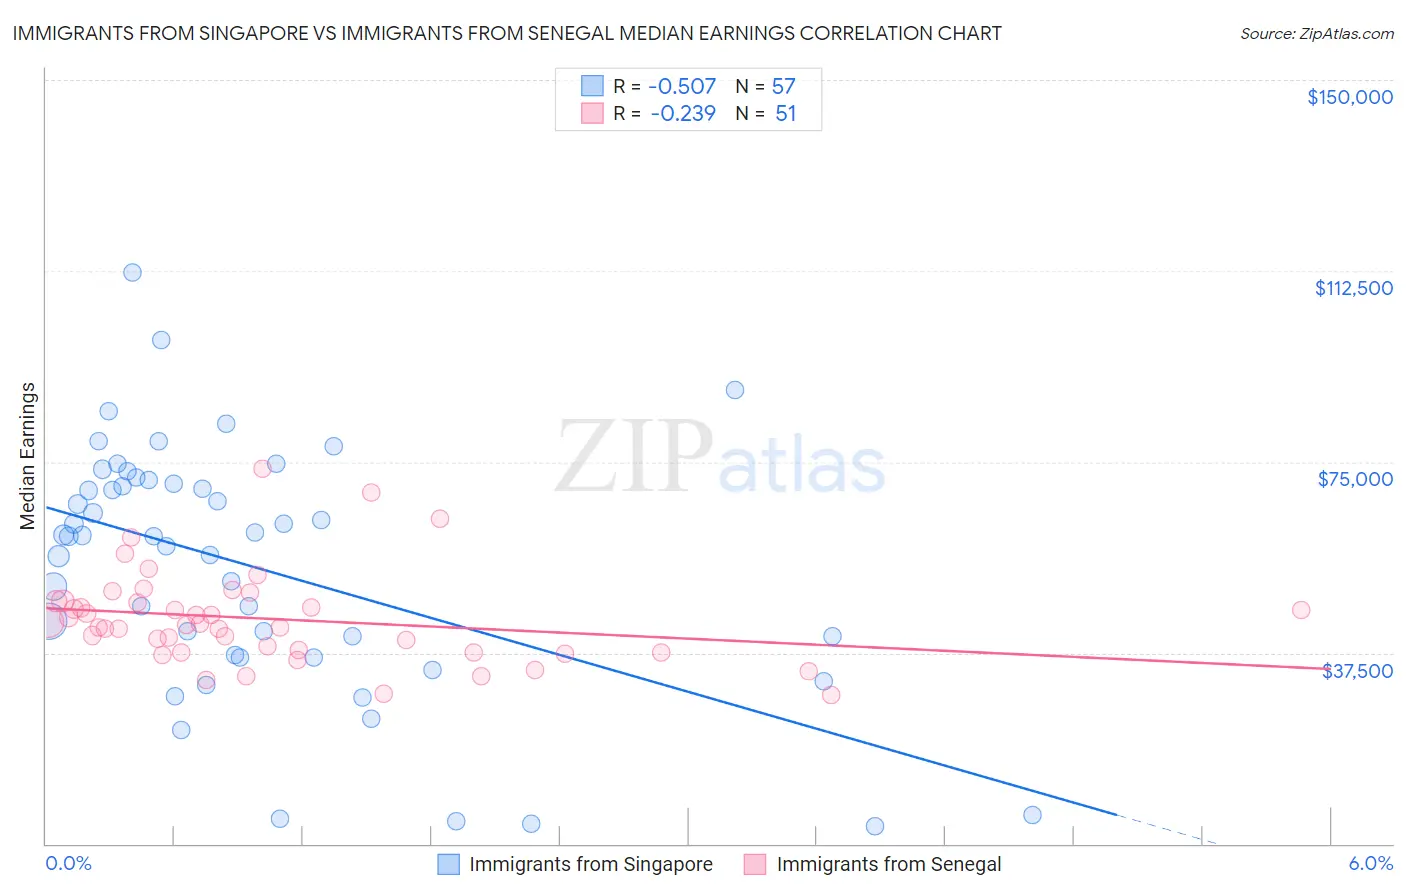
Immigrants from Singapore vs Immigrants from Senegal Median Earnings Correlation Chart
The statistical analysis conducted on geographies consisting of 137,505,488 people shows a substantial negative correlation between the proportion of Immigrants from Singapore and median earnings in the United States with a correlation coefficient (R) of -0.507 and weighted average of $59,038. Similarly, the statistical analysis conducted on geographies consisting of 90,128,045 people shows a weak negative correlation between the proportion of Immigrants from Senegal and median earnings in the United States with a correlation coefficient (R) of -0.239 and weighted average of $45,611, a difference of 29.4%.
Median Earnings Correlation Summary
| Measurement | Immigrants from Singapore | Immigrants from Senegal |
| Minimum | $3,412 | $29,284 |
| Maximum | $112,087 | $73,618 |
| Range | $108,675 | $44,334 |
| Mean | $54,277 | $44,131 |
| Median | $60,355 | $43,043 |
| Interquartile 25% (IQ1) | $36,759 | $37,628 |
| Interquartile 75% (IQ3) | $71,145 | $47,719 |
| Interquartile Range (IQR) | $34,386 | $10,091 |
| Standard Deviation (Sample) | $24,368 | $9,098 |
| Standard Deviation (Population) | $24,153 | $9,008 |
Similar Demographics by Median Earnings
Demographics Similar to Immigrants from Singapore by Median Earnings
In terms of median earnings, the demographic groups most similar to Immigrants from Singapore are Thai ($59,237, a difference of 0.34%), Immigrants from Hong Kong ($59,433, a difference of 0.67%), Iranian ($58,474, a difference of 0.97%), Immigrants from Iran ($57,612, a difference of 2.5%), and Okinawan ($57,550, a difference of 2.6%).
| Demographics | Rating | Rank | Median Earnings |
| Filipinos | 100.0 /100 | #1 | Exceptional $61,197 |
| Immigrants | Taiwan | 100.0 /100 | #2 | Exceptional $61,151 |
| Immigrants | India | 100.0 /100 | #3 | Exceptional $60,648 |
| Immigrants | Hong Kong | 100.0 /100 | #4 | Exceptional $59,433 |
| Thais | 100.0 /100 | #5 | Exceptional $59,237 |
| Immigrants | Singapore | 100.0 /100 | #6 | Exceptional $59,038 |
| Iranians | 100.0 /100 | #7 | Exceptional $58,474 |
| Immigrants | Iran | 100.0 /100 | #8 | Exceptional $57,612 |
| Okinawans | 100.0 /100 | #9 | Exceptional $57,550 |
| Immigrants | South Central Asia | 100.0 /100 | #10 | Exceptional $57,114 |
| Immigrants | Israel | 100.0 /100 | #11 | Exceptional $57,034 |
| Immigrants | Ireland | 100.0 /100 | #12 | Exceptional $56,854 |
| Immigrants | China | 100.0 /100 | #13 | Exceptional $56,638 |
| Immigrants | Australia | 100.0 /100 | #14 | Exceptional $56,305 |
| Indians (Asian) | 100.0 /100 | #15 | Exceptional $56,253 |
Demographics Similar to Immigrants from Senegal by Median Earnings
In terms of median earnings, the demographic groups most similar to Immigrants from Senegal are Immigrants from Bosnia and Herzegovina ($45,600, a difference of 0.020%), Immigrants from Thailand ($45,598, a difference of 0.030%), Immigrants from Grenada ($45,596, a difference of 0.030%), Panamanian ($45,593, a difference of 0.040%), and Bermudan ($45,593, a difference of 0.040%).
| Demographics | Rating | Rank | Median Earnings |
| Immigrants | Azores | 29.5 /100 | #200 | Fair $45,812 |
| Celtics | 27.2 /100 | #201 | Fair $45,732 |
| Immigrants | Trinidad and Tobago | 27.1 /100 | #202 | Fair $45,729 |
| Welsh | 26.6 /100 | #203 | Fair $45,710 |
| Immigrants | Uruguay | 25.9 /100 | #204 | Fair $45,682 |
| Tongans | 25.4 /100 | #205 | Fair $45,665 |
| Immigrants | Ghana | 24.8 /100 | #206 | Fair $45,641 |
| Immigrants | Senegal | 24.0 /100 | #207 | Fair $45,611 |
| Immigrants | Bosnia and Herzegovina | 23.7 /100 | #208 | Fair $45,600 |
| Immigrants | Thailand | 23.7 /100 | #209 | Fair $45,598 |
| Immigrants | Grenada | 23.6 /100 | #210 | Fair $45,596 |
| Panamanians | 23.5 /100 | #211 | Fair $45,593 |
| Bermudans | 23.5 /100 | #212 | Fair $45,593 |
| Immigrants | Colombia | 22.4 /100 | #213 | Fair $45,550 |
| Nigerians | 22.0 /100 | #214 | Fair $45,532 |