Immigrants from Guatemala vs Immigrants from Senegal Median Earnings
COMPARE
Immigrants from Guatemala
Immigrants from Senegal
Median Earnings
Median Earnings Comparison
Immigrants from Guatemala
Immigrants from Senegal
$40,851
MEDIAN EARNINGS
0.0/ 100
METRIC RATING
304th/ 347
METRIC RANK
$45,611
MEDIAN EARNINGS
24.0/ 100
METRIC RATING
207th/ 347
METRIC RANK
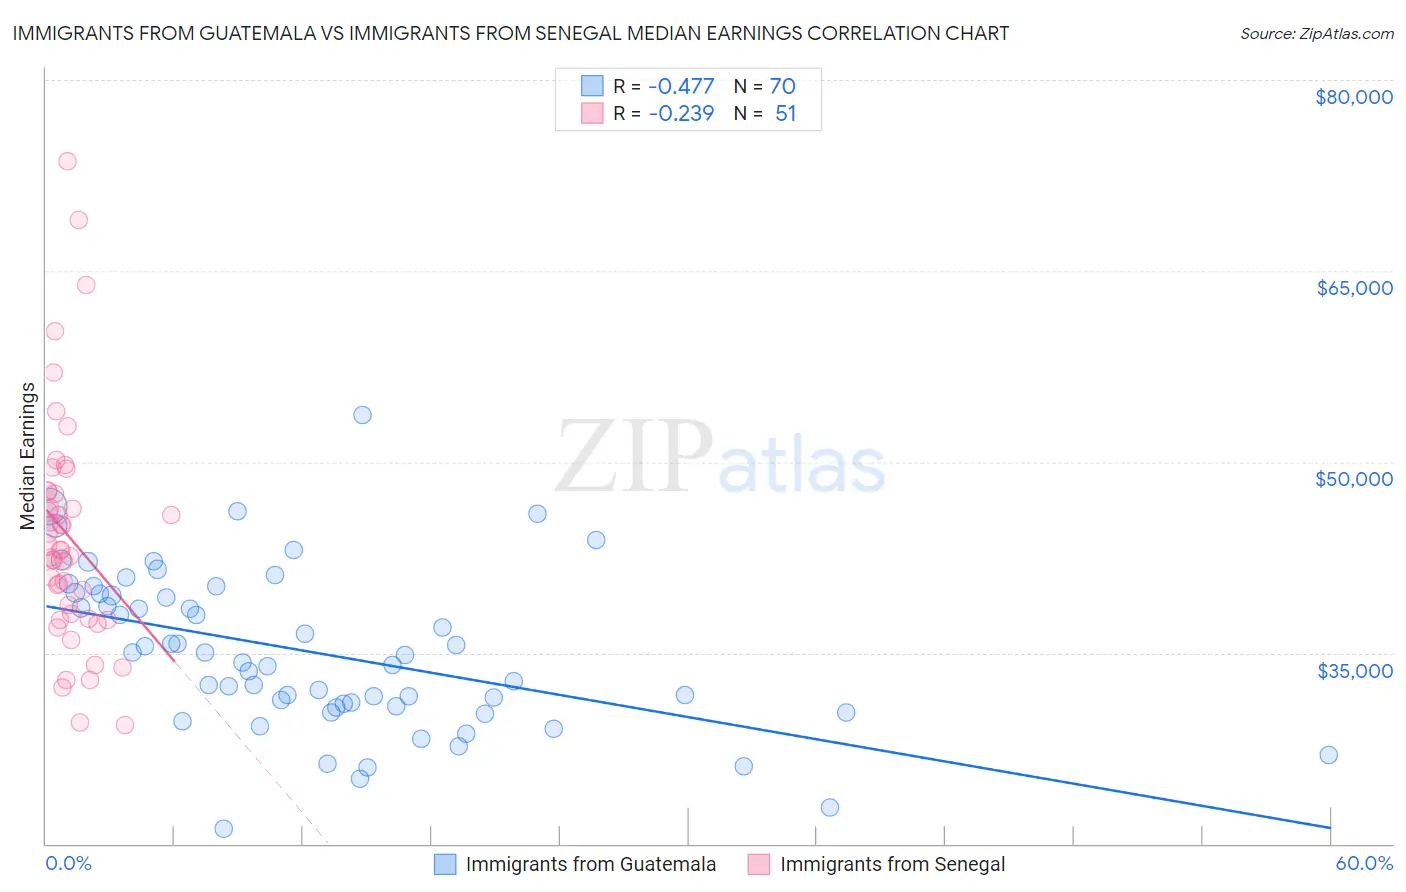
Immigrants from Guatemala vs Immigrants from Senegal Median Earnings Correlation Chart
The statistical analysis conducted on geographies consisting of 377,268,152 people shows a moderate negative correlation between the proportion of Immigrants from Guatemala and median earnings in the United States with a correlation coefficient (R) of -0.477 and weighted average of $40,851. Similarly, the statistical analysis conducted on geographies consisting of 90,128,045 people shows a weak negative correlation between the proportion of Immigrants from Senegal and median earnings in the United States with a correlation coefficient (R) of -0.239 and weighted average of $45,611, a difference of 11.7%.
Median Earnings Correlation Summary
| Measurement | Immigrants from Guatemala | Immigrants from Senegal |
| Minimum | $21,140 | $29,284 |
| Maximum | $53,713 | $73,618 |
| Range | $32,573 | $44,334 |
| Mean | $35,043 | $44,131 |
| Median | $34,514 | $43,043 |
| Interquartile 25% (IQ1) | $30,761 | $37,628 |
| Interquartile 75% (IQ3) | $39,604 | $47,719 |
| Interquartile Range (IQR) | $8,843 | $10,091 |
| Standard Deviation (Sample) | $6,256 | $9,098 |
| Standard Deviation (Population) | $6,211 | $9,008 |
Similar Demographics by Median Earnings
Demographics Similar to Immigrants from Guatemala by Median Earnings
In terms of median earnings, the demographic groups most similar to Immigrants from Guatemala are Haitian ($40,918, a difference of 0.16%), Shoshone ($40,932, a difference of 0.20%), Chickasaw ($40,672, a difference of 0.44%), Immigrants from Latin America ($41,049, a difference of 0.48%), and Ute ($41,051, a difference of 0.49%).
| Demographics | Rating | Rank | Median Earnings |
| Guatemalans | 0.1 /100 | #297 | Tragic $41,205 |
| Immigrants | Micronesia | 0.1 /100 | #298 | Tragic $41,133 |
| Immigrants | Caribbean | 0.1 /100 | #299 | Tragic $41,119 |
| Ute | 0.1 /100 | #300 | Tragic $41,051 |
| Immigrants | Latin America | 0.1 /100 | #301 | Tragic $41,049 |
| Shoshone | 0.0 /100 | #302 | Tragic $40,932 |
| Haitians | 0.0 /100 | #303 | Tragic $40,918 |
| Immigrants | Guatemala | 0.0 /100 | #304 | Tragic $40,851 |
| Chickasaw | 0.0 /100 | #305 | Tragic $40,672 |
| Yaqui | 0.0 /100 | #306 | Tragic $40,647 |
| Hondurans | 0.0 /100 | #307 | Tragic $40,638 |
| Cubans | 0.0 /100 | #308 | Tragic $40,619 |
| Immigrants | Haiti | 0.0 /100 | #309 | Tragic $40,550 |
| Apache | 0.0 /100 | #310 | Tragic $40,388 |
| Hispanics or Latinos | 0.0 /100 | #311 | Tragic $40,288 |
Demographics Similar to Immigrants from Senegal by Median Earnings
In terms of median earnings, the demographic groups most similar to Immigrants from Senegal are Immigrants from Bosnia and Herzegovina ($45,600, a difference of 0.020%), Immigrants from Thailand ($45,598, a difference of 0.030%), Immigrants from Grenada ($45,596, a difference of 0.030%), Panamanian ($45,593, a difference of 0.040%), and Bermudan ($45,593, a difference of 0.040%).
| Demographics | Rating | Rank | Median Earnings |
| Immigrants | Azores | 29.5 /100 | #200 | Fair $45,812 |
| Celtics | 27.2 /100 | #201 | Fair $45,732 |
| Immigrants | Trinidad and Tobago | 27.1 /100 | #202 | Fair $45,729 |
| Welsh | 26.6 /100 | #203 | Fair $45,710 |
| Immigrants | Uruguay | 25.9 /100 | #204 | Fair $45,682 |
| Tongans | 25.4 /100 | #205 | Fair $45,665 |
| Immigrants | Ghana | 24.8 /100 | #206 | Fair $45,641 |
| Immigrants | Senegal | 24.0 /100 | #207 | Fair $45,611 |
| Immigrants | Bosnia and Herzegovina | 23.7 /100 | #208 | Fair $45,600 |
| Immigrants | Thailand | 23.7 /100 | #209 | Fair $45,598 |
| Immigrants | Grenada | 23.6 /100 | #210 | Fair $45,596 |
| Panamanians | 23.5 /100 | #211 | Fair $45,593 |
| Bermudans | 23.5 /100 | #212 | Fair $45,593 |
| Immigrants | Colombia | 22.4 /100 | #213 | Fair $45,550 |
| Nigerians | 22.0 /100 | #214 | Fair $45,532 |