Immigrants from Trinidad and Tobago vs Tlingit-Haida Median Male Earnings
COMPARE
Immigrants from Trinidad and Tobago
Tlingit-Haida
Median Male Earnings
Median Male Earnings Comparison
Immigrants from Trinidad and Tobago
Tlingit-Haida
$51,376
MEDIAN MALE EARNINGS
4.5/ 100
METRIC RATING
229th/ 347
METRIC RANK
$52,409
MEDIAN MALE EARNINGS
11.5/ 100
METRIC RATING
211th/ 347
METRIC RANK
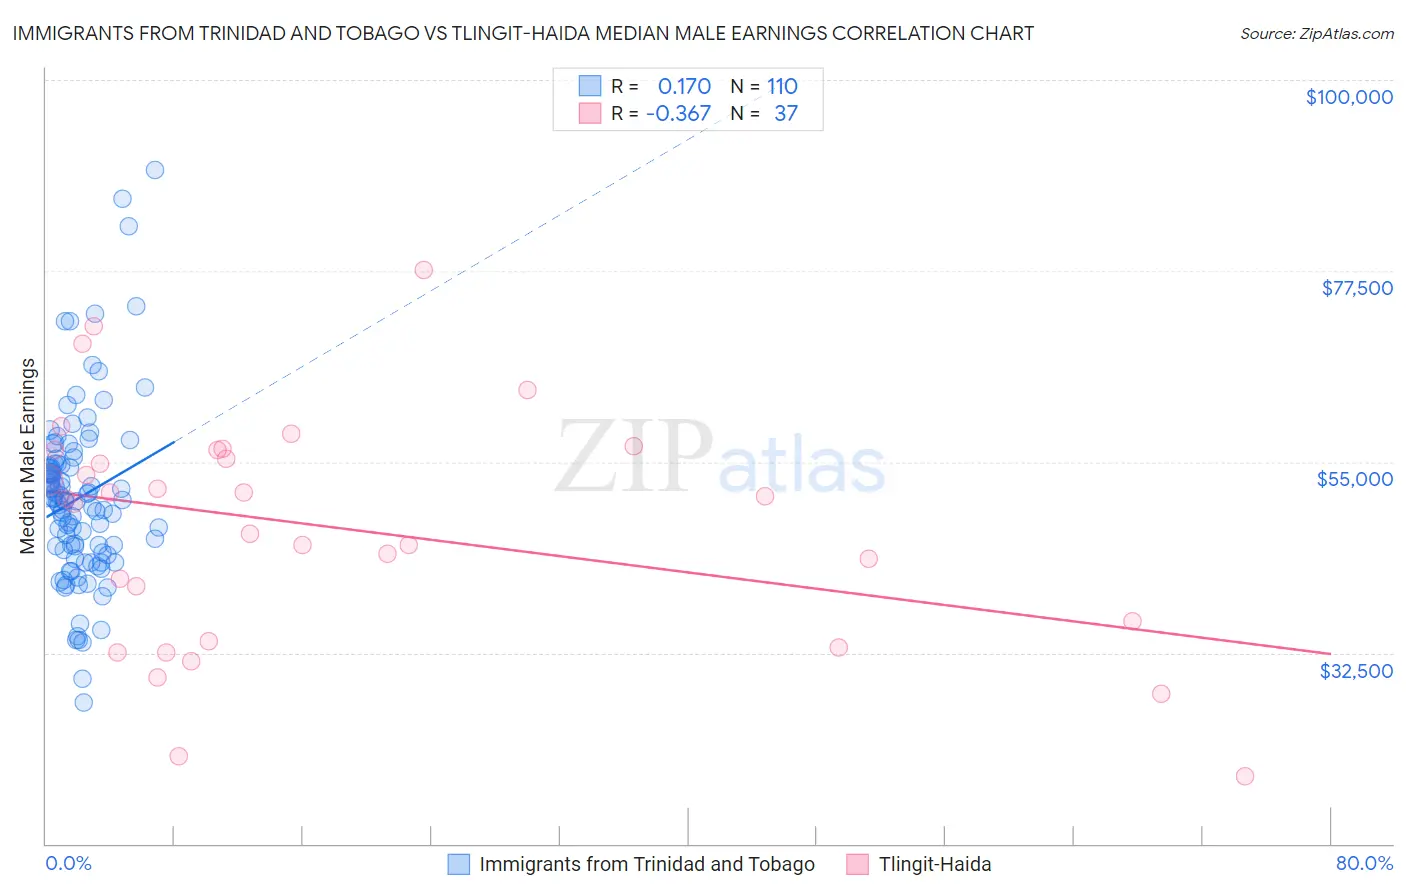
Immigrants from Trinidad and Tobago vs Tlingit-Haida Median Male Earnings Correlation Chart
The statistical analysis conducted on geographies consisting of 223,506,487 people shows a poor positive correlation between the proportion of Immigrants from Trinidad and Tobago and median male earnings in the United States with a correlation coefficient (R) of 0.170 and weighted average of $51,376. Similarly, the statistical analysis conducted on geographies consisting of 60,863,896 people shows a mild negative correlation between the proportion of Tlingit-Haida and median male earnings in the United States with a correlation coefficient (R) of -0.367 and weighted average of $52,409, a difference of 2.0%.
Median Male Earnings Correlation Summary
| Measurement | Immigrants from Trinidad and Tobago | Tlingit-Haida |
| Minimum | $26,715 | $17,917 |
| Maximum | $89,464 | $77,679 |
| Range | $62,749 | $59,762 |
| Mean | $50,788 | $47,277 |
| Median | $50,334 | $50,705 |
| Interquartile 25% (IQ1) | $44,350 | $35,036 |
| Interquartile 75% (IQ3) | $54,816 | $56,386 |
| Interquartile Range (IQR) | $10,466 | $21,350 |
| Standard Deviation (Sample) | $10,499 | $13,635 |
| Standard Deviation (Population) | $10,451 | $13,450 |
Demographics Similar to Immigrants from Trinidad and Tobago and Tlingit-Haida by Median Male Earnings
In terms of median male earnings, the demographic groups most similar to Immigrants from Trinidad and Tobago are Samoan ($51,389, a difference of 0.030%), Immigrants from Nigeria ($51,310, a difference of 0.13%), Trinidadian and Tobagonian ($51,446, a difference of 0.14%), Japanese ($51,473, a difference of 0.19%), and Immigrants from Sudan ($51,489, a difference of 0.22%). Similarly, the demographic groups most similar to Tlingit-Haida are Delaware ($52,412, a difference of 0.010%), Cajun ($52,325, a difference of 0.16%), Native Hawaiian ($52,306, a difference of 0.20%), Nonimmigrants ($52,170, a difference of 0.46%), and Immigrants from Cameroon ($52,119, a difference of 0.56%).
| Demographics | Rating | Rank | Median Male Earnings |
| Delaware | 11.5 /100 | #210 | Poor $52,412 |
| Tlingit-Haida | 11.5 /100 | #211 | Poor $52,409 |
| Cajuns | 10.7 /100 | #212 | Poor $52,325 |
| Native Hawaiians | 10.5 /100 | #213 | Poor $52,306 |
| Immigrants | Nonimmigrants | 9.3 /100 | #214 | Tragic $52,170 |
| Immigrants | Cameroon | 8.9 /100 | #215 | Tragic $52,119 |
| Immigrants | Venezuela | 8.3 /100 | #216 | Tragic $52,041 |
| Nigerians | 8.3 /100 | #217 | Tragic $52,039 |
| Immigrants | Panama | 7.7 /100 | #218 | Tragic $51,962 |
| Immigrants | Ghana | 6.9 /100 | #219 | Tragic $51,836 |
| Immigrants | Armenia | 6.6 /100 | #220 | Tragic $51,793 |
| Immigrants | Senegal | 5.8 /100 | #221 | Tragic $51,647 |
| Immigrants | Bangladesh | 5.8 /100 | #222 | Tragic $51,642 |
| Ecuadorians | 5.5 /100 | #223 | Tragic $51,596 |
| Immigrants | Cambodia | 5.5 /100 | #224 | Tragic $51,594 |
| Immigrants | Sudan | 5.0 /100 | #225 | Tragic $51,489 |
| Japanese | 4.9 /100 | #226 | Tragic $51,473 |
| Trinidadians and Tobagonians | 4.8 /100 | #227 | Tragic $51,446 |
| Samoans | 4.6 /100 | #228 | Tragic $51,389 |
| Immigrants | Trinidad and Tobago | 4.5 /100 | #229 | Tragic $51,376 |
| Immigrants | Nigeria | 4.2 /100 | #230 | Tragic $51,310 |