Slavic vs Tlingit-Haida Median Male Earnings
COMPARE
Slavic
Tlingit-Haida
Median Male Earnings
Median Male Earnings Comparison
Slavs
Tlingit-Haida
$56,390
MEDIAN MALE EARNINGS
86.5/ 100
METRIC RATING
137th/ 347
METRIC RANK
$52,409
MEDIAN MALE EARNINGS
11.5/ 100
METRIC RATING
211th/ 347
METRIC RANK
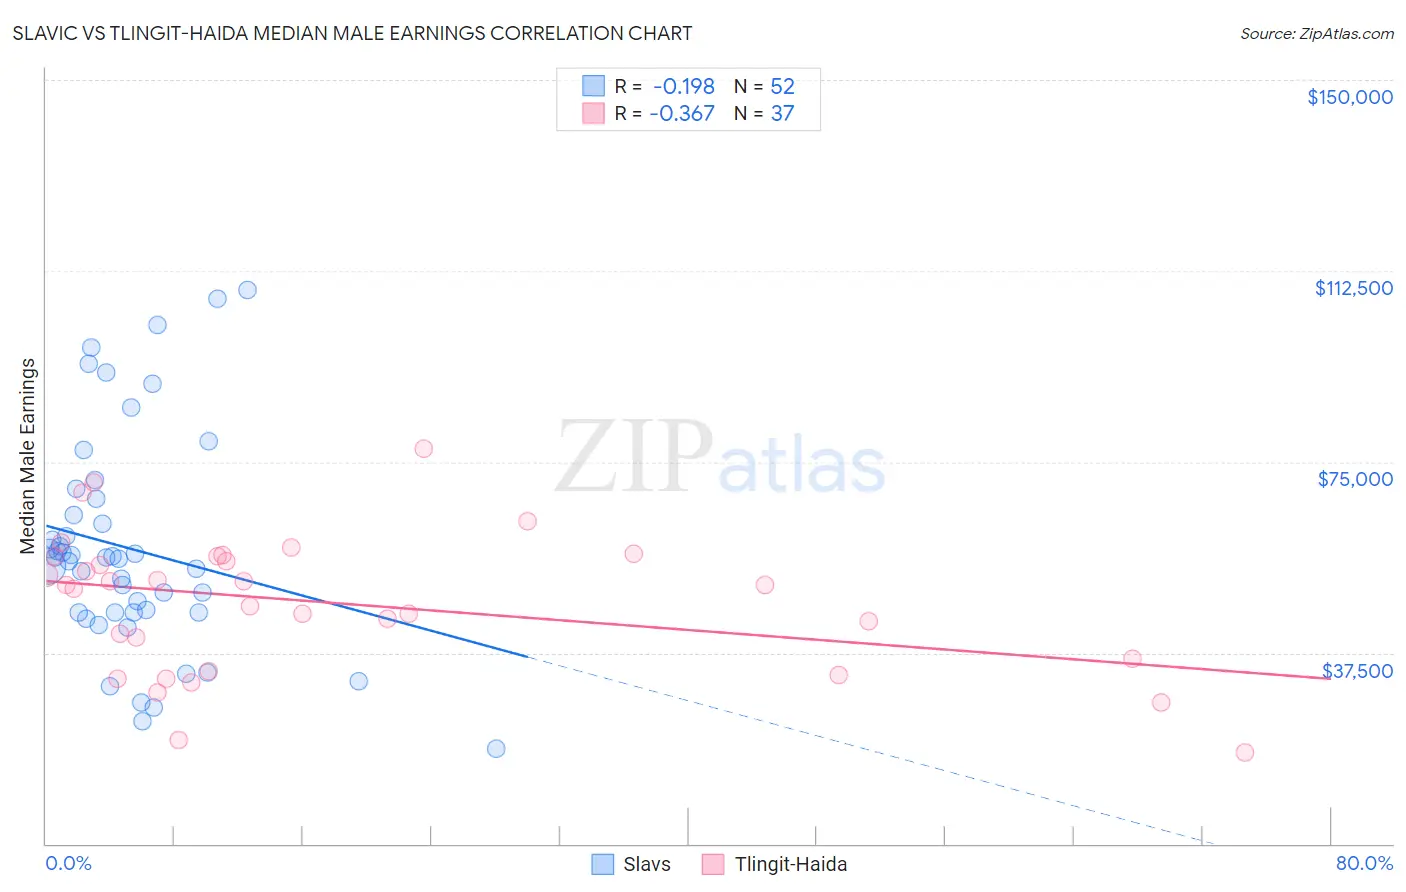
Slavic vs Tlingit-Haida Median Male Earnings Correlation Chart
The statistical analysis conducted on geographies consisting of 270,818,256 people shows a poor negative correlation between the proportion of Slavs and median male earnings in the United States with a correlation coefficient (R) of -0.198 and weighted average of $56,390. Similarly, the statistical analysis conducted on geographies consisting of 60,863,896 people shows a mild negative correlation between the proportion of Tlingit-Haida and median male earnings in the United States with a correlation coefficient (R) of -0.367 and weighted average of $52,409, a difference of 7.6%.
Median Male Earnings Correlation Summary
| Measurement | Slavic | Tlingit-Haida |
| Minimum | $18,676 | $17,917 |
| Maximum | $108,806 | $77,679 |
| Range | $90,130 | $59,762 |
| Mean | $57,922 | $47,277 |
| Median | $56,132 | $50,705 |
| Interquartile 25% (IQ1) | $45,442 | $35,036 |
| Interquartile 75% (IQ3) | $66,210 | $56,386 |
| Interquartile Range (IQR) | $20,768 | $21,350 |
| Standard Deviation (Sample) | $21,311 | $13,635 |
| Standard Deviation (Population) | $21,105 | $13,450 |
Similar Demographics by Median Male Earnings
Demographics Similar to Slavs by Median Male Earnings
In terms of median male earnings, the demographic groups most similar to Slavs are Immigrants from Saudi Arabia ($56,452, a difference of 0.11%), Irish ($56,464, a difference of 0.13%), Slovak ($56,306, a difference of 0.15%), Zimbabwean ($56,302, a difference of 0.16%), and Luxembourger ($56,300, a difference of 0.16%).
| Demographics | Rating | Rank | Median Male Earnings |
| Koreans | 89.4 /100 | #130 | Excellent $56,672 |
| Portuguese | 89.4 /100 | #131 | Excellent $56,663 |
| Czechs | 88.2 /100 | #132 | Excellent $56,546 |
| Immigrants | Germany | 88.2 /100 | #133 | Excellent $56,542 |
| Moroccans | 87.7 /100 | #134 | Excellent $56,499 |
| Irish | 87.4 /100 | #135 | Excellent $56,464 |
| Immigrants | Saudi Arabia | 87.2 /100 | #136 | Excellent $56,452 |
| Slavs | 86.5 /100 | #137 | Excellent $56,390 |
| Slovaks | 85.5 /100 | #138 | Excellent $56,306 |
| Zimbabweans | 85.5 /100 | #139 | Excellent $56,302 |
| Luxembourgers | 85.5 /100 | #140 | Excellent $56,300 |
| Danes | 84.8 /100 | #141 | Excellent $56,246 |
| Ethiopians | 84.8 /100 | #142 | Excellent $56,243 |
| Sri Lankans | 83.4 /100 | #143 | Excellent $56,136 |
| Immigrants | Uganda | 82.4 /100 | #144 | Excellent $56,064 |
Demographics Similar to Tlingit-Haida by Median Male Earnings
In terms of median male earnings, the demographic groups most similar to Tlingit-Haida are Delaware ($52,412, a difference of 0.010%), Bermudan ($52,465, a difference of 0.11%), Cajun ($52,325, a difference of 0.16%), Venezuelan ($52,510, a difference of 0.19%), and Native Hawaiian ($52,306, a difference of 0.20%).
| Demographics | Rating | Rank | Median Male Earnings |
| Ghanaians | 16.1 /100 | #204 | Poor $52,810 |
| Immigrants | Colombia | 15.0 /100 | #205 | Poor $52,725 |
| Immigrants | Iraq | 14.5 /100 | #206 | Poor $52,681 |
| Vietnamese | 12.7 /100 | #207 | Poor $52,525 |
| Venezuelans | 12.5 /100 | #208 | Poor $52,510 |
| Bermudans | 12.1 /100 | #209 | Poor $52,465 |
| Delaware | 11.5 /100 | #210 | Poor $52,412 |
| Tlingit-Haida | 11.5 /100 | #211 | Poor $52,409 |
| Cajuns | 10.7 /100 | #212 | Poor $52,325 |
| Native Hawaiians | 10.5 /100 | #213 | Poor $52,306 |
| Immigrants | Nonimmigrants | 9.3 /100 | #214 | Tragic $52,170 |
| Immigrants | Cameroon | 8.9 /100 | #215 | Tragic $52,119 |
| Immigrants | Venezuela | 8.3 /100 | #216 | Tragic $52,041 |
| Nigerians | 8.3 /100 | #217 | Tragic $52,039 |
| Immigrants | Panama | 7.7 /100 | #218 | Tragic $51,962 |