Ukrainian vs Tlingit-Haida Median Male Earnings
COMPARE
Ukrainian
Tlingit-Haida
Median Male Earnings
Median Male Earnings Comparison
Ukrainians
Tlingit-Haida
$59,728
MEDIAN MALE EARNINGS
99.4/ 100
METRIC RATING
81st/ 347
METRIC RANK
$52,409
MEDIAN MALE EARNINGS
11.5/ 100
METRIC RATING
211th/ 347
METRIC RANK
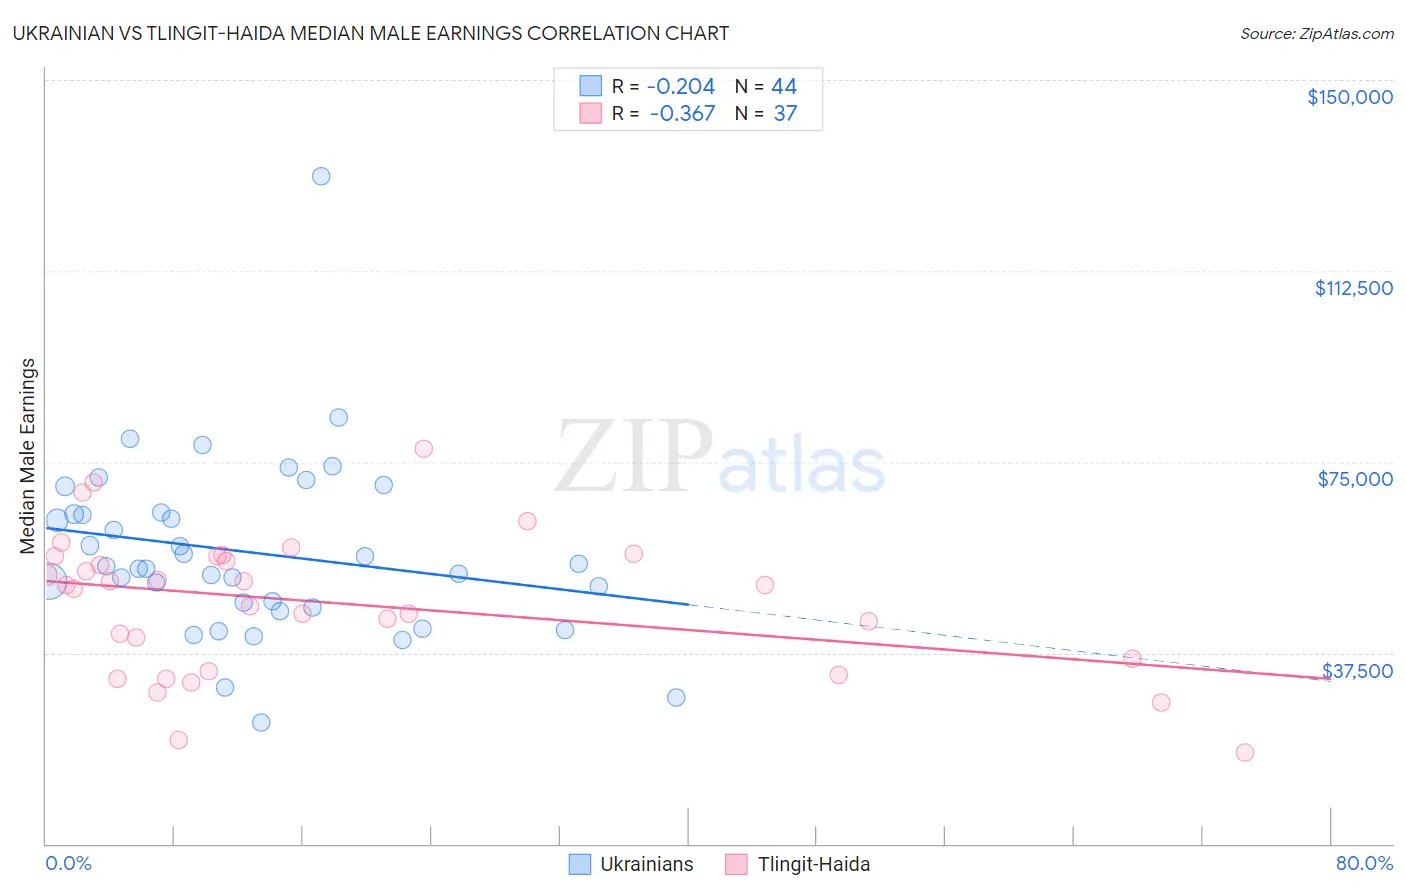
Ukrainian vs Tlingit-Haida Median Male Earnings Correlation Chart
The statistical analysis conducted on geographies consisting of 448,432,137 people shows a weak negative correlation between the proportion of Ukrainians and median male earnings in the United States with a correlation coefficient (R) of -0.204 and weighted average of $59,728. Similarly, the statistical analysis conducted on geographies consisting of 60,863,896 people shows a mild negative correlation between the proportion of Tlingit-Haida and median male earnings in the United States with a correlation coefficient (R) of -0.367 and weighted average of $52,409, a difference of 14.0%.
Median Male Earnings Correlation Summary
| Measurement | Ukrainian | Tlingit-Haida |
| Minimum | $23,696 | $17,917 |
| Maximum | $131,091 | $77,679 |
| Range | $107,394 | $59,762 |
| Mean | $57,214 | $47,277 |
| Median | $54,259 | $50,705 |
| Interquartile 25% (IQ1) | $46,850 | $35,036 |
| Interquartile 75% (IQ3) | $64,861 | $56,386 |
| Interquartile Range (IQR) | $18,011 | $21,350 |
| Standard Deviation (Sample) | $17,751 | $13,635 |
| Standard Deviation (Population) | $17,548 | $13,450 |
Similar Demographics by Median Male Earnings
Demographics Similar to Ukrainians by Median Male Earnings
In terms of median male earnings, the demographic groups most similar to Ukrainians are Croatian ($59,715, a difference of 0.020%), Immigrants from Italy ($59,691, a difference of 0.060%), Immigrants from Hungary ($59,806, a difference of 0.13%), Immigrants from Ukraine ($59,820, a difference of 0.16%), and Afghan ($59,554, a difference of 0.29%).
| Demographics | Rating | Rank | Median Male Earnings |
| Argentineans | 99.6 /100 | #74 | Exceptional $60,117 |
| Immigrants | Bolivia | 99.6 /100 | #75 | Exceptional $60,088 |
| Romanians | 99.6 /100 | #76 | Exceptional $60,063 |
| Paraguayans | 99.5 /100 | #77 | Exceptional $59,975 |
| Immigrants | Egypt | 99.5 /100 | #78 | Exceptional $59,925 |
| Immigrants | Ukraine | 99.5 /100 | #79 | Exceptional $59,820 |
| Immigrants | Hungary | 99.5 /100 | #80 | Exceptional $59,806 |
| Ukrainians | 99.4 /100 | #81 | Exceptional $59,728 |
| Croatians | 99.4 /100 | #82 | Exceptional $59,715 |
| Immigrants | Italy | 99.4 /100 | #83 | Exceptional $59,691 |
| Afghans | 99.3 /100 | #84 | Exceptional $59,554 |
| Italians | 99.3 /100 | #85 | Exceptional $59,551 |
| Immigrants | England | 99.3 /100 | #86 | Exceptional $59,527 |
| Macedonians | 99.3 /100 | #87 | Exceptional $59,522 |
| Immigrants | Argentina | 99.3 /100 | #88 | Exceptional $59,491 |
Demographics Similar to Tlingit-Haida by Median Male Earnings
In terms of median male earnings, the demographic groups most similar to Tlingit-Haida are Delaware ($52,412, a difference of 0.010%), Bermudan ($52,465, a difference of 0.11%), Cajun ($52,325, a difference of 0.16%), Venezuelan ($52,510, a difference of 0.19%), and Native Hawaiian ($52,306, a difference of 0.20%).
| Demographics | Rating | Rank | Median Male Earnings |
| Ghanaians | 16.1 /100 | #204 | Poor $52,810 |
| Immigrants | Colombia | 15.0 /100 | #205 | Poor $52,725 |
| Immigrants | Iraq | 14.5 /100 | #206 | Poor $52,681 |
| Vietnamese | 12.7 /100 | #207 | Poor $52,525 |
| Venezuelans | 12.5 /100 | #208 | Poor $52,510 |
| Bermudans | 12.1 /100 | #209 | Poor $52,465 |
| Delaware | 11.5 /100 | #210 | Poor $52,412 |
| Tlingit-Haida | 11.5 /100 | #211 | Poor $52,409 |
| Cajuns | 10.7 /100 | #212 | Poor $52,325 |
| Native Hawaiians | 10.5 /100 | #213 | Poor $52,306 |
| Immigrants | Nonimmigrants | 9.3 /100 | #214 | Tragic $52,170 |
| Immigrants | Cameroon | 8.9 /100 | #215 | Tragic $52,119 |
| Immigrants | Venezuela | 8.3 /100 | #216 | Tragic $52,041 |
| Nigerians | 8.3 /100 | #217 | Tragic $52,039 |
| Immigrants | Panama | 7.7 /100 | #218 | Tragic $51,962 |