Immigrants from Sri Lanka vs Tlingit-Haida Median Male Earnings
COMPARE
Immigrants from Sri Lanka
Tlingit-Haida
Median Male Earnings
Median Male Earnings Comparison
Immigrants from Sri Lanka
Tlingit-Haida
$63,099
MEDIAN MALE EARNINGS
100.0/ 100
METRIC RATING
37th/ 347
METRIC RANK
$52,409
MEDIAN MALE EARNINGS
11.5/ 100
METRIC RATING
211th/ 347
METRIC RANK
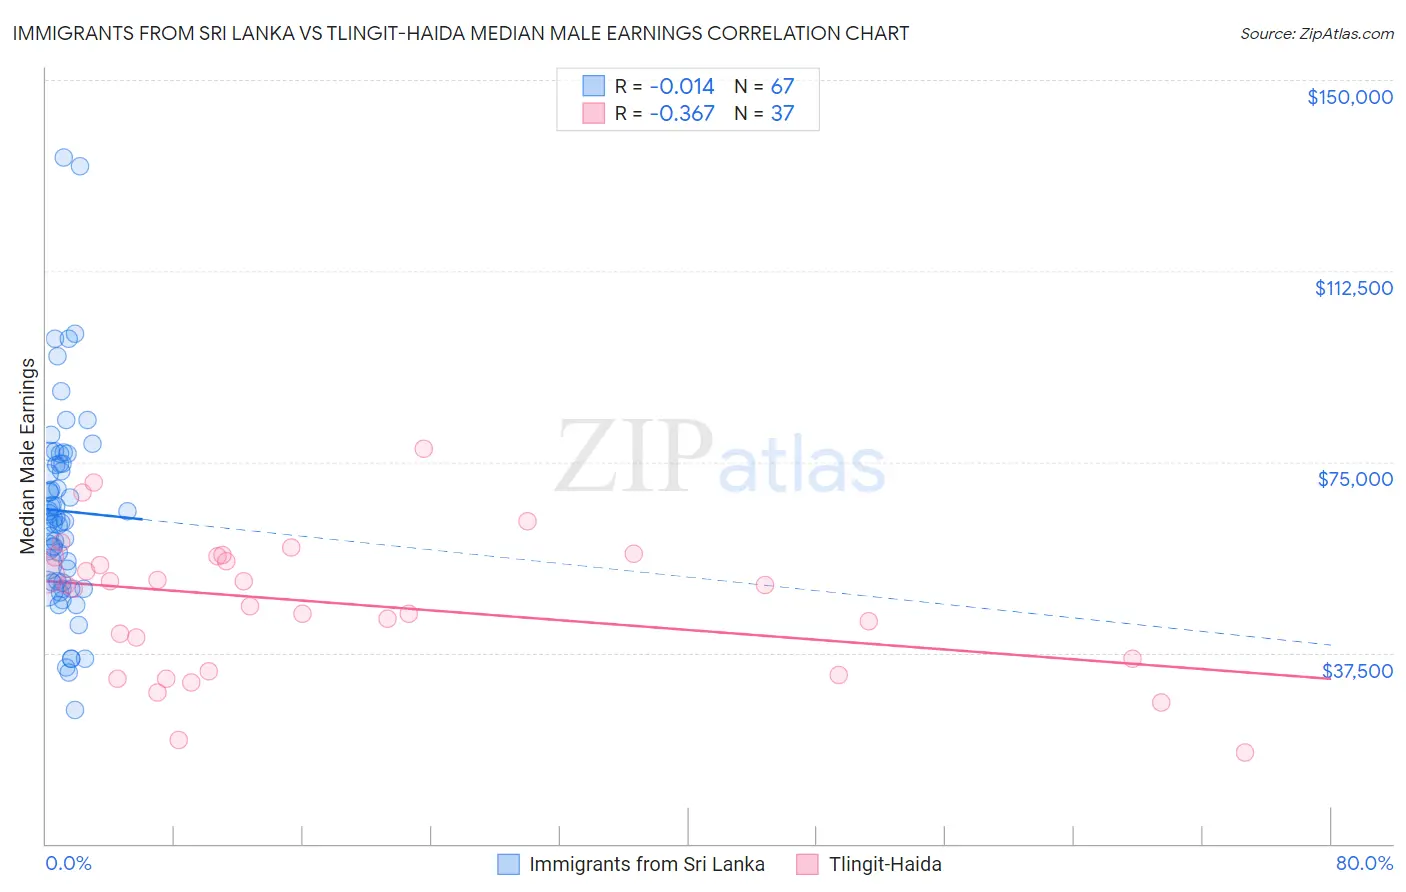
Immigrants from Sri Lanka vs Tlingit-Haida Median Male Earnings Correlation Chart
The statistical analysis conducted on geographies consisting of 149,678,305 people shows no correlation between the proportion of Immigrants from Sri Lanka and median male earnings in the United States with a correlation coefficient (R) of -0.014 and weighted average of $63,099. Similarly, the statistical analysis conducted on geographies consisting of 60,863,896 people shows a mild negative correlation between the proportion of Tlingit-Haida and median male earnings in the United States with a correlation coefficient (R) of -0.367 and weighted average of $52,409, a difference of 20.4%.
Median Male Earnings Correlation Summary
| Measurement | Immigrants from Sri Lanka | Tlingit-Haida |
| Minimum | $26,357 | $17,917 |
| Maximum | $134,837 | $77,679 |
| Range | $108,480 | $59,762 |
| Mean | $65,375 | $47,277 |
| Median | $63,858 | $50,705 |
| Interquartile 25% (IQ1) | $51,338 | $35,036 |
| Interquartile 75% (IQ3) | $74,628 | $56,386 |
| Interquartile Range (IQR) | $23,290 | $21,350 |
| Standard Deviation (Sample) | $20,034 | $13,635 |
| Standard Deviation (Population) | $19,884 | $13,450 |
Similar Demographics by Median Male Earnings
Demographics Similar to Immigrants from Sri Lanka by Median Male Earnings
In terms of median male earnings, the demographic groups most similar to Immigrants from Sri Lanka are Israeli ($63,228, a difference of 0.20%), Immigrants from Asia ($63,240, a difference of 0.22%), Maltese ($62,953, a difference of 0.23%), Immigrants from South Africa ($62,899, a difference of 0.32%), and Immigrants from Russia ($63,326, a difference of 0.36%).
| Demographics | Rating | Rank | Median Male Earnings |
| Immigrants | France | 100.0 /100 | #30 | Exceptional $63,715 |
| Latvians | 100.0 /100 | #31 | Exceptional $63,498 |
| Soviet Union | 100.0 /100 | #32 | Exceptional $63,382 |
| Immigrants | Lithuania | 100.0 /100 | #33 | Exceptional $63,346 |
| Immigrants | Russia | 100.0 /100 | #34 | Exceptional $63,326 |
| Immigrants | Asia | 100.0 /100 | #35 | Exceptional $63,240 |
| Israelis | 100.0 /100 | #36 | Exceptional $63,228 |
| Immigrants | Sri Lanka | 100.0 /100 | #37 | Exceptional $63,099 |
| Maltese | 100.0 /100 | #38 | Exceptional $62,953 |
| Immigrants | South Africa | 100.0 /100 | #39 | Exceptional $62,899 |
| Australians | 100.0 /100 | #40 | Exceptional $62,857 |
| Immigrants | Turkey | 100.0 /100 | #41 | Exceptional $62,728 |
| Immigrants | Greece | 100.0 /100 | #42 | Exceptional $62,689 |
| Immigrants | Belarus | 100.0 /100 | #43 | Exceptional $62,658 |
| Cambodians | 100.0 /100 | #44 | Exceptional $62,516 |
Demographics Similar to Tlingit-Haida by Median Male Earnings
In terms of median male earnings, the demographic groups most similar to Tlingit-Haida are Delaware ($52,412, a difference of 0.010%), Bermudan ($52,465, a difference of 0.11%), Cajun ($52,325, a difference of 0.16%), Venezuelan ($52,510, a difference of 0.19%), and Native Hawaiian ($52,306, a difference of 0.20%).
| Demographics | Rating | Rank | Median Male Earnings |
| Ghanaians | 16.1 /100 | #204 | Poor $52,810 |
| Immigrants | Colombia | 15.0 /100 | #205 | Poor $52,725 |
| Immigrants | Iraq | 14.5 /100 | #206 | Poor $52,681 |
| Vietnamese | 12.7 /100 | #207 | Poor $52,525 |
| Venezuelans | 12.5 /100 | #208 | Poor $52,510 |
| Bermudans | 12.1 /100 | #209 | Poor $52,465 |
| Delaware | 11.5 /100 | #210 | Poor $52,412 |
| Tlingit-Haida | 11.5 /100 | #211 | Poor $52,409 |
| Cajuns | 10.7 /100 | #212 | Poor $52,325 |
| Native Hawaiians | 10.5 /100 | #213 | Poor $52,306 |
| Immigrants | Nonimmigrants | 9.3 /100 | #214 | Tragic $52,170 |
| Immigrants | Cameroon | 8.9 /100 | #215 | Tragic $52,119 |
| Immigrants | Venezuela | 8.3 /100 | #216 | Tragic $52,041 |
| Nigerians | 8.3 /100 | #217 | Tragic $52,039 |
| Immigrants | Panama | 7.7 /100 | #218 | Tragic $51,962 |