Yaqui vs Tlingit-Haida Median Male Earnings
COMPARE
Yaqui
Tlingit-Haida
Median Male Earnings
Median Male Earnings Comparison
Yaqui
Tlingit-Haida
$46,777
MEDIAN MALE EARNINGS
0.1/ 100
METRIC RATING
303rd/ 347
METRIC RANK
$52,409
MEDIAN MALE EARNINGS
11.5/ 100
METRIC RATING
211th/ 347
METRIC RANK
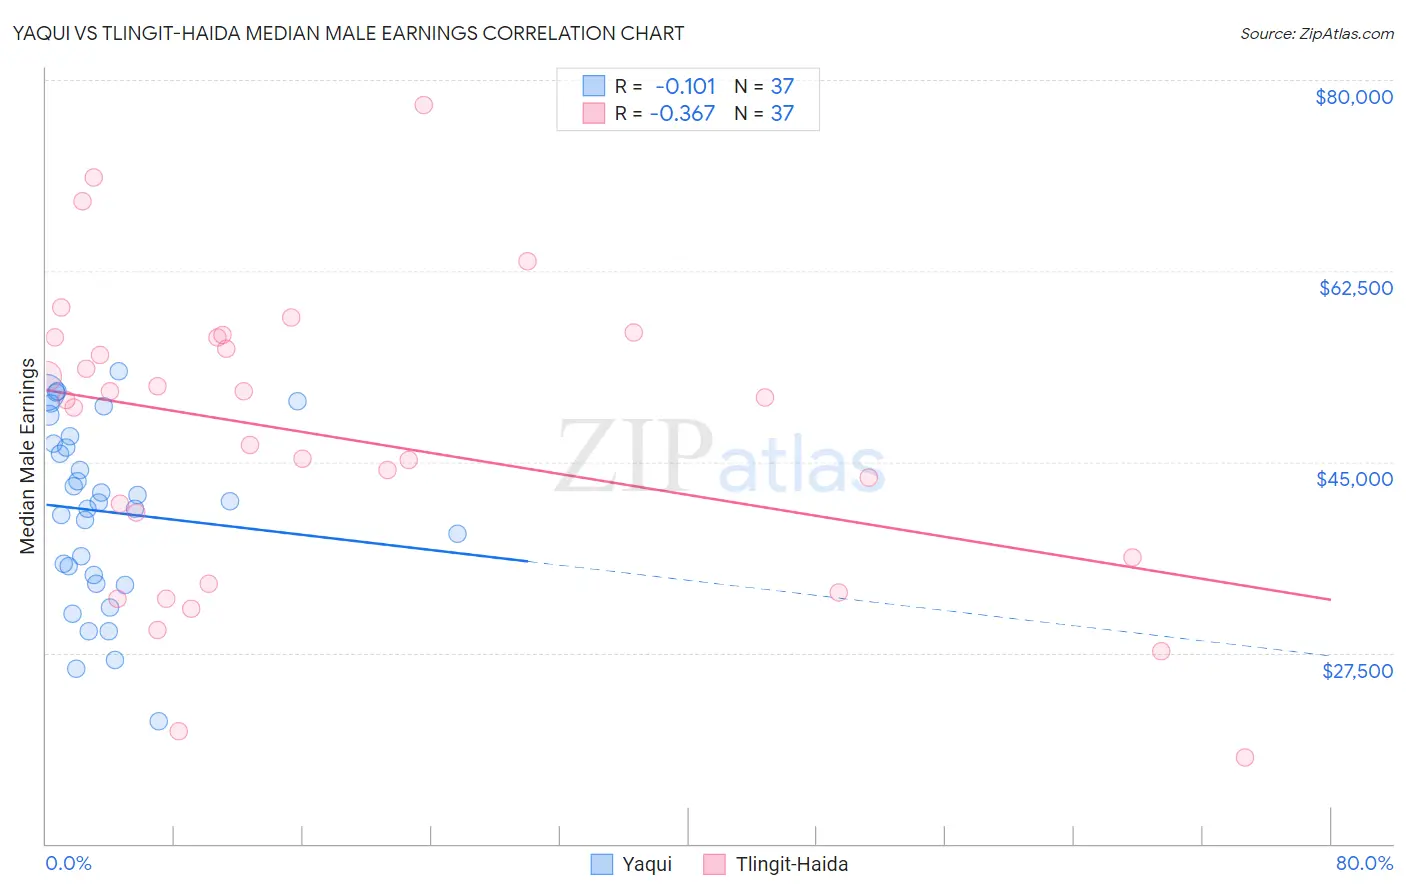
Yaqui vs Tlingit-Haida Median Male Earnings Correlation Chart
The statistical analysis conducted on geographies consisting of 107,723,867 people shows a poor negative correlation between the proportion of Yaqui and median male earnings in the United States with a correlation coefficient (R) of -0.101 and weighted average of $46,777. Similarly, the statistical analysis conducted on geographies consisting of 60,863,896 people shows a mild negative correlation between the proportion of Tlingit-Haida and median male earnings in the United States with a correlation coefficient (R) of -0.367 and weighted average of $52,409, a difference of 12.0%.
Median Male Earnings Correlation Summary
| Measurement | Yaqui | Tlingit-Haida |
| Minimum | $21,192 | $17,917 |
| Maximum | $53,274 | $77,679 |
| Range | $32,082 | $59,762 |
| Mean | $40,430 | $47,277 |
| Median | $41,328 | $50,705 |
| Interquartile 25% (IQ1) | $34,244 | $35,036 |
| Interquartile 75% (IQ3) | $46,983 | $56,386 |
| Interquartile Range (IQR) | $12,738 | $21,350 |
| Standard Deviation (Sample) | $8,232 | $13,635 |
| Standard Deviation (Population) | $8,120 | $13,450 |
Similar Demographics by Median Male Earnings
Demographics Similar to Yaqui by Median Male Earnings
In terms of median male earnings, the demographic groups most similar to Yaqui are Seminole ($46,783, a difference of 0.010%), Bangladeshi ($46,744, a difference of 0.070%), Guatemalan ($46,736, a difference of 0.090%), Dutch West Indian ($46,656, a difference of 0.26%), and Immigrants from Dominican Republic ($46,655, a difference of 0.26%).
| Demographics | Rating | Rank | Median Male Earnings |
| Inupiat | 0.1 /100 | #296 | Tragic $47,281 |
| Dominicans | 0.1 /100 | #297 | Tragic $47,204 |
| Immigrants | Micronesia | 0.1 /100 | #298 | Tragic $47,177 |
| Immigrants | Zaire | 0.1 /100 | #299 | Tragic $47,070 |
| U.S. Virgin Islanders | 0.1 /100 | #300 | Tragic $47,066 |
| Immigrants | Latin America | 0.1 /100 | #301 | Tragic $46,941 |
| Seminole | 0.1 /100 | #302 | Tragic $46,783 |
| Yaqui | 0.1 /100 | #303 | Tragic $46,777 |
| Bangladeshis | 0.1 /100 | #304 | Tragic $46,744 |
| Guatemalans | 0.0 /100 | #305 | Tragic $46,736 |
| Dutch West Indians | 0.0 /100 | #306 | Tragic $46,656 |
| Immigrants | Dominican Republic | 0.0 /100 | #307 | Tragic $46,655 |
| Ottawa | 0.0 /100 | #308 | Tragic $46,611 |
| Creek | 0.0 /100 | #309 | Tragic $46,594 |
| Cubans | 0.0 /100 | #310 | Tragic $46,580 |
Demographics Similar to Tlingit-Haida by Median Male Earnings
In terms of median male earnings, the demographic groups most similar to Tlingit-Haida are Delaware ($52,412, a difference of 0.010%), Bermudan ($52,465, a difference of 0.11%), Cajun ($52,325, a difference of 0.16%), Venezuelan ($52,510, a difference of 0.19%), and Native Hawaiian ($52,306, a difference of 0.20%).
| Demographics | Rating | Rank | Median Male Earnings |
| Ghanaians | 16.1 /100 | #204 | Poor $52,810 |
| Immigrants | Colombia | 15.0 /100 | #205 | Poor $52,725 |
| Immigrants | Iraq | 14.5 /100 | #206 | Poor $52,681 |
| Vietnamese | 12.7 /100 | #207 | Poor $52,525 |
| Venezuelans | 12.5 /100 | #208 | Poor $52,510 |
| Bermudans | 12.1 /100 | #209 | Poor $52,465 |
| Delaware | 11.5 /100 | #210 | Poor $52,412 |
| Tlingit-Haida | 11.5 /100 | #211 | Poor $52,409 |
| Cajuns | 10.7 /100 | #212 | Poor $52,325 |
| Native Hawaiians | 10.5 /100 | #213 | Poor $52,306 |
| Immigrants | Nonimmigrants | 9.3 /100 | #214 | Tragic $52,170 |
| Immigrants | Cameroon | 8.9 /100 | #215 | Tragic $52,119 |
| Immigrants | Venezuela | 8.3 /100 | #216 | Tragic $52,041 |
| Nigerians | 8.3 /100 | #217 | Tragic $52,039 |
| Immigrants | Panama | 7.7 /100 | #218 | Tragic $51,962 |