Greek vs Samoan Median Family Income
COMPARE
Greek
Samoan
Median Family Income
Median Family Income Comparison
Greeks
Samoans
$115,192
MEDIAN FAMILY INCOME
99.8/ 100
METRIC RATING
57th/ 347
METRIC RANK
$100,344
MEDIAN FAMILY INCOME
23.3/ 100
METRIC RATING
196th/ 347
METRIC RANK
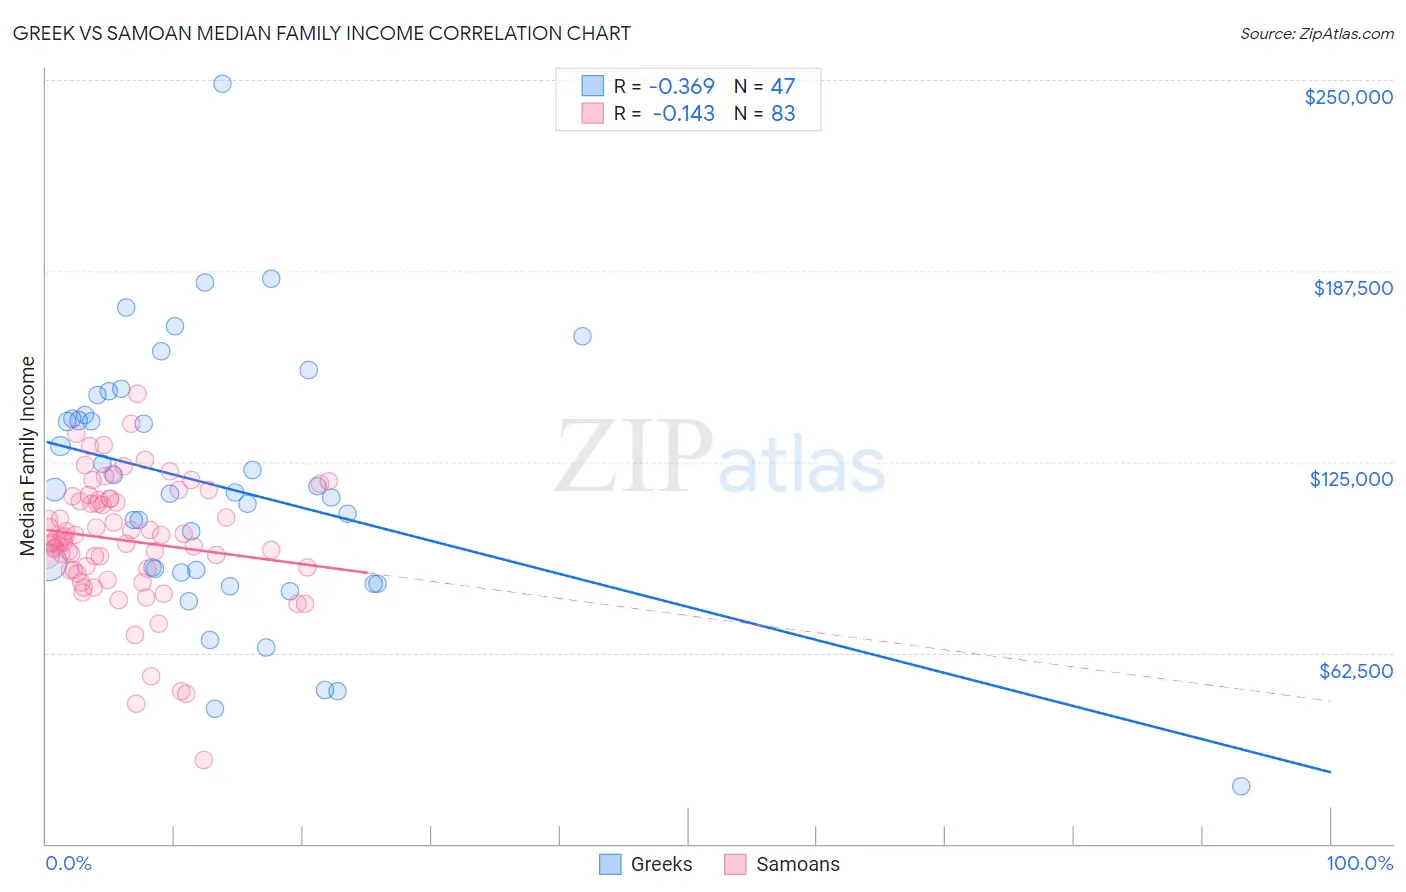
Greek vs Samoan Median Family Income Correlation Chart
The statistical analysis conducted on geographies consisting of 482,131,670 people shows a mild negative correlation between the proportion of Greeks and median family income in the United States with a correlation coefficient (R) of -0.369 and weighted average of $115,192. Similarly, the statistical analysis conducted on geographies consisting of 225,048,976 people shows a poor negative correlation between the proportion of Samoans and median family income in the United States with a correlation coefficient (R) of -0.143 and weighted average of $100,344, a difference of 14.8%.
Median Family Income Correlation Summary
| Measurement | Greek | Samoan |
| Minimum | $18,825 | $27,294 |
| Maximum | $248,750 | $147,200 |
| Range | $229,925 | $119,906 |
| Mean | $116,811 | $99,252 |
| Median | $115,024 | $99,920 |
| Interquartile 25% (IQ1) | $88,890 | $89,665 |
| Interquartile 75% (IQ3) | $140,272 | $112,813 |
| Interquartile Range (IQR) | $51,382 | $23,148 |
| Standard Deviation (Sample) | $42,578 | $20,629 |
| Standard Deviation (Population) | $42,122 | $20,504 |
Similar Demographics by Median Family Income
Demographics Similar to Greeks by Median Family Income
In terms of median family income, the demographic groups most similar to Greeks are New Zealander ($115,230, a difference of 0.030%), Immigrants from Indonesia ($115,162, a difference of 0.030%), Lithuanian ($115,395, a difference of 0.18%), Immigrants from Netherlands ($114,987, a difference of 0.18%), and Immigrants from Europe ($115,523, a difference of 0.29%).
| Demographics | Rating | Rank | Median Family Income |
| Immigrants | Czechoslovakia | 99.9 /100 | #50 | Exceptional $116,165 |
| Immigrants | Malaysia | 99.9 /100 | #51 | Exceptional $115,880 |
| Maltese | 99.9 /100 | #52 | Exceptional $115,862 |
| Immigrants | Norway | 99.9 /100 | #53 | Exceptional $115,847 |
| Immigrants | Europe | 99.9 /100 | #54 | Exceptional $115,523 |
| Lithuanians | 99.8 /100 | #55 | Exceptional $115,395 |
| New Zealanders | 99.8 /100 | #56 | Exceptional $115,230 |
| Greeks | 99.8 /100 | #57 | Exceptional $115,192 |
| Immigrants | Indonesia | 99.8 /100 | #58 | Exceptional $115,162 |
| Immigrants | Netherlands | 99.8 /100 | #59 | Exceptional $114,987 |
| Immigrants | Latvia | 99.8 /100 | #60 | Exceptional $114,826 |
| Immigrants | Belarus | 99.8 /100 | #61 | Exceptional $114,586 |
| Mongolians | 99.8 /100 | #62 | Exceptional $114,553 |
| Immigrants | Pakistan | 99.8 /100 | #63 | Exceptional $114,406 |
| Immigrants | Scotland | 99.7 /100 | #64 | Exceptional $114,392 |
Demographics Similar to Samoans by Median Family Income
In terms of median family income, the demographic groups most similar to Samoans are Immigrants from Cameroon ($100,289, a difference of 0.060%), Immigrants from South America ($100,414, a difference of 0.070%), Immigrants from Africa ($100,256, a difference of 0.090%), Yugoslavian ($100,119, a difference of 0.22%), and Iraqi ($100,658, a difference of 0.31%).
| Demographics | Rating | Rank | Median Family Income |
| Immigrants | Portugal | 29.6 /100 | #189 | Fair $100,984 |
| Immigrants | Immigrants | 29.4 /100 | #190 | Fair $100,962 |
| Colombians | 27.2 /100 | #191 | Fair $100,750 |
| Immigrants | Kenya | 26.5 /100 | #192 | Fair $100,679 |
| Iraqis | 26.3 /100 | #193 | Fair $100,658 |
| Uruguayans | 26.3 /100 | #194 | Fair $100,656 |
| Immigrants | South America | 23.9 /100 | #195 | Fair $100,414 |
| Samoans | 23.3 /100 | #196 | Fair $100,344 |
| Immigrants | Cameroon | 22.8 /100 | #197 | Fair $100,289 |
| Immigrants | Africa | 22.5 /100 | #198 | Fair $100,256 |
| Yugoslavians | 21.3 /100 | #199 | Fair $100,119 |
| Spanish | 20.1 /100 | #200 | Fair $99,977 |
| Immigrants | Thailand | 19.0 /100 | #201 | Poor $99,840 |
| Whites/Caucasians | 18.7 /100 | #202 | Poor $99,800 |
| Scotch-Irish | 17.1 /100 | #203 | Poor $99,591 |