Ghanaian vs Serbian Median Female Earnings
COMPARE
Ghanaian
Serbian
Median Female Earnings
Median Female Earnings Comparison
Ghanaians
Serbians
$40,429
MEDIAN FEMALE EARNINGS
82.1/ 100
METRIC RATING
146th/ 347
METRIC RANK
$40,539
MEDIAN FEMALE EARNINGS
85.2/ 100
METRIC RATING
140th/ 347
METRIC RANK
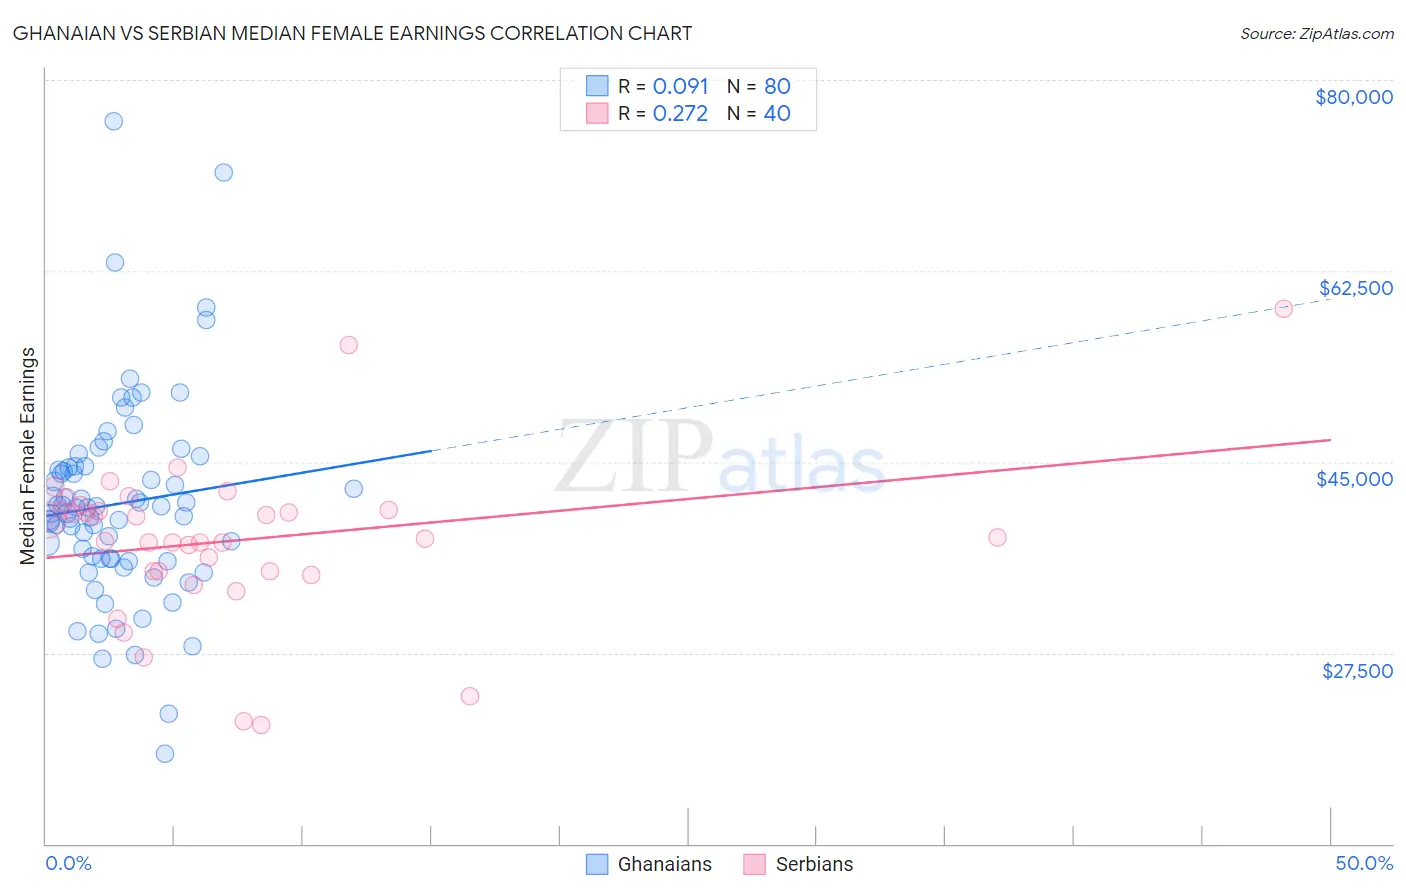
Ghanaian vs Serbian Median Female Earnings Correlation Chart
The statistical analysis conducted on geographies consisting of 190,707,731 people shows a slight positive correlation between the proportion of Ghanaians and median female earnings in the United States with a correlation coefficient (R) of 0.091 and weighted average of $40,429. Similarly, the statistical analysis conducted on geographies consisting of 267,582,893 people shows a weak positive correlation between the proportion of Serbians and median female earnings in the United States with a correlation coefficient (R) of 0.272 and weighted average of $40,539, a difference of 0.27%.
Median Female Earnings Correlation Summary
| Measurement | Ghanaian | Serbian |
| Minimum | $18,266 | $20,870 |
| Maximum | $76,246 | $59,044 |
| Range | $57,980 | $38,174 |
| Mean | $41,171 | $37,788 |
| Median | $40,828 | $38,020 |
| Interquartile 25% (IQ1) | $36,123 | $34,950 |
| Interquartile 75% (IQ3) | $44,535 | $40,620 |
| Interquartile Range (IQR) | $8,413 | $5,670 |
| Standard Deviation (Sample) | $9,292 | $7,286 |
| Standard Deviation (Population) | $9,234 | $7,194 |
Demographics Similar to Ghanaians and Serbians by Median Female Earnings
In terms of median female earnings, the demographic groups most similar to Ghanaians are Brazilian ($40,483, a difference of 0.13%), Vietnamese ($40,377, a difference of 0.13%), Northern European ($40,491, a difference of 0.15%), Immigrants from North Macedonia ($40,488, a difference of 0.15%), and Polish ($40,371, a difference of 0.15%). Similarly, the demographic groups most similar to Serbians are Immigrants from South Eastern Asia ($40,558, a difference of 0.050%), Taiwanese ($40,576, a difference of 0.090%), Immigrants from Syria ($40,499, a difference of 0.10%), Sri Lankan ($40,496, a difference of 0.10%), and Northern European ($40,491, a difference of 0.12%).
| Demographics | Rating | Rank | Median Female Earnings |
| Syrians | 89.5 /100 | #133 | Excellent $40,727 |
| Arabs | 89.3 /100 | #134 | Excellent $40,718 |
| Immigrants | Nepal | 89.0 /100 | #135 | Excellent $40,704 |
| Immigrants | Eastern Africa | 87.7 /100 | #136 | Excellent $40,644 |
| Pakistanis | 86.6 /100 | #137 | Excellent $40,596 |
| Taiwanese | 86.1 /100 | #138 | Excellent $40,576 |
| Immigrants | South Eastern Asia | 85.7 /100 | #139 | Excellent $40,558 |
| Serbians | 85.2 /100 | #140 | Excellent $40,539 |
| Immigrants | Syria | 84.1 /100 | #141 | Excellent $40,499 |
| Sri Lankans | 84.0 /100 | #142 | Excellent $40,496 |
| Northern Europeans | 83.9 /100 | #143 | Excellent $40,491 |
| Immigrants | North Macedonia | 83.8 /100 | #144 | Excellent $40,488 |
| Brazilians | 83.6 /100 | #145 | Excellent $40,483 |
| Ghanaians | 82.1 /100 | #146 | Excellent $40,429 |
| Vietnamese | 80.4 /100 | #147 | Excellent $40,377 |
| Poles | 80.2 /100 | #148 | Excellent $40,371 |
| Immigrants | Cameroon | 79.7 /100 | #149 | Good $40,354 |
| Immigrants | Chile | 79.6 /100 | #150 | Good $40,353 |
| Immigrants | Armenia | 79.2 /100 | #151 | Good $40,340 |
| West Indians | 78.4 /100 | #152 | Good $40,317 |
| British West Indians | 77.7 /100 | #153 | Good $40,299 |