Ghanaian vs Immigrants from Mexico Median Female Earnings
COMPARE
Ghanaian
Immigrants from Mexico
Median Female Earnings
Median Female Earnings Comparison
Ghanaians
Immigrants from Mexico
$40,429
MEDIAN FEMALE EARNINGS
82.1/ 100
METRIC RATING
146th/ 347
METRIC RANK
$33,236
MEDIAN FEMALE EARNINGS
0.0/ 100
METRIC RATING
339th/ 347
METRIC RANK
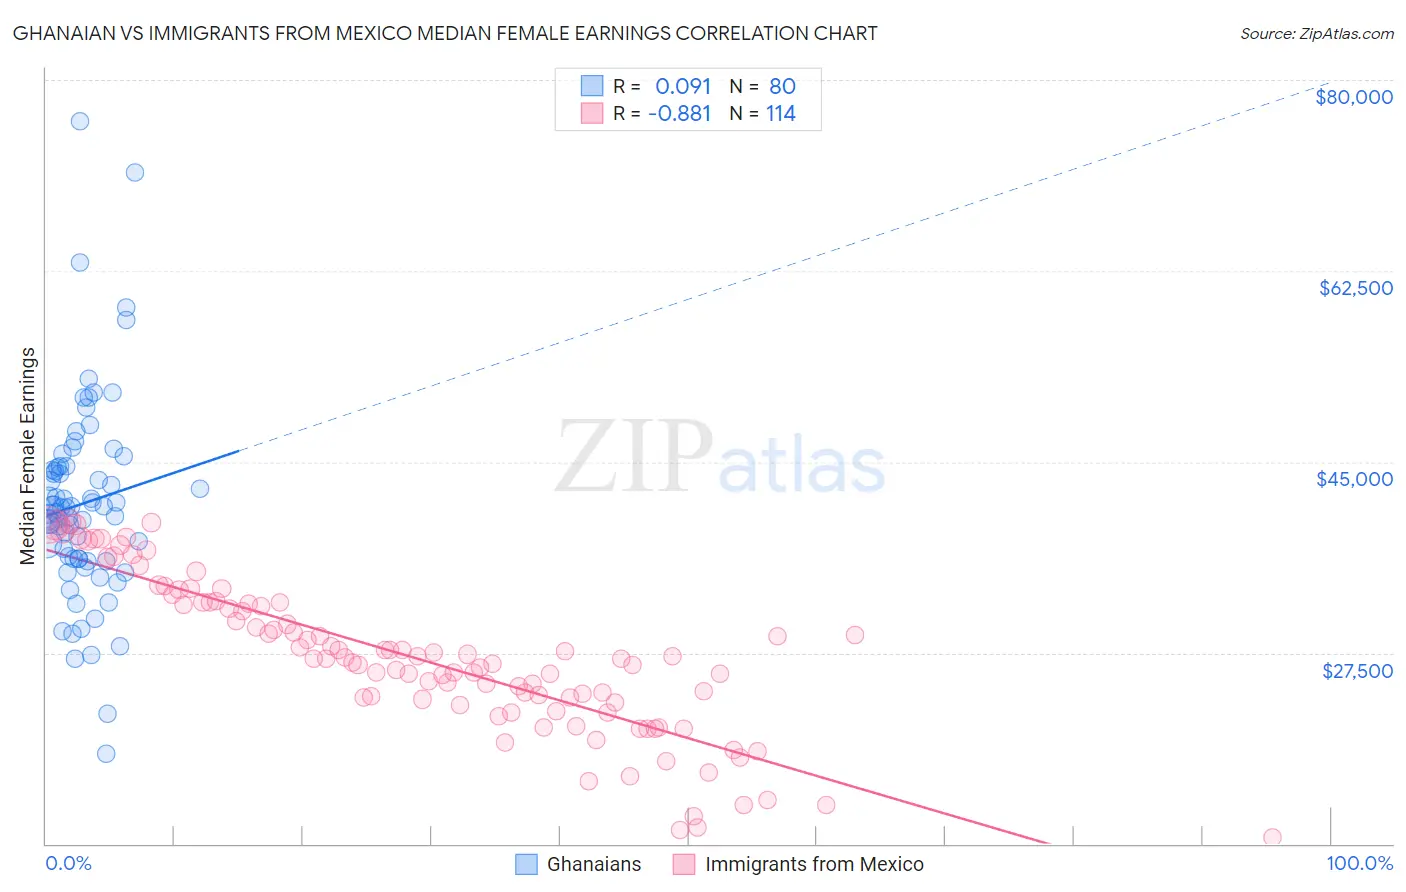
Ghanaian vs Immigrants from Mexico Median Female Earnings Correlation Chart
The statistical analysis conducted on geographies consisting of 190,707,731 people shows a slight positive correlation between the proportion of Ghanaians and median female earnings in the United States with a correlation coefficient (R) of 0.091 and weighted average of $40,429. Similarly, the statistical analysis conducted on geographies consisting of 512,787,138 people shows a very strong negative correlation between the proportion of Immigrants from Mexico and median female earnings in the United States with a correlation coefficient (R) of -0.881 and weighted average of $33,236, a difference of 21.6%.
Median Female Earnings Correlation Summary
| Measurement | Ghanaian | Immigrants from Mexico |
| Minimum | $18,266 | $10,532 |
| Maximum | $76,246 | $39,508 |
| Range | $57,980 | $28,976 |
| Mean | $41,171 | $26,933 |
| Median | $40,828 | $26,949 |
| Interquartile 25% (IQ1) | $36,123 | $22,999 |
| Interquartile 75% (IQ3) | $44,535 | $32,002 |
| Interquartile Range (IQR) | $8,413 | $9,003 |
| Standard Deviation (Sample) | $9,292 | $6,963 |
| Standard Deviation (Population) | $9,234 | $6,932 |
Similar Demographics by Median Female Earnings
Demographics Similar to Ghanaians by Median Female Earnings
In terms of median female earnings, the demographic groups most similar to Ghanaians are Brazilian ($40,483, a difference of 0.13%), Vietnamese ($40,377, a difference of 0.13%), Northern European ($40,491, a difference of 0.15%), Immigrants from North Macedonia ($40,488, a difference of 0.15%), and Polish ($40,371, a difference of 0.15%).
| Demographics | Rating | Rank | Median Female Earnings |
| Immigrants | South Eastern Asia | 85.7 /100 | #139 | Excellent $40,558 |
| Serbians | 85.2 /100 | #140 | Excellent $40,539 |
| Immigrants | Syria | 84.1 /100 | #141 | Excellent $40,499 |
| Sri Lankans | 84.0 /100 | #142 | Excellent $40,496 |
| Northern Europeans | 83.9 /100 | #143 | Excellent $40,491 |
| Immigrants | North Macedonia | 83.8 /100 | #144 | Excellent $40,488 |
| Brazilians | 83.6 /100 | #145 | Excellent $40,483 |
| Ghanaians | 82.1 /100 | #146 | Excellent $40,429 |
| Vietnamese | 80.4 /100 | #147 | Excellent $40,377 |
| Poles | 80.2 /100 | #148 | Excellent $40,371 |
| Immigrants | Cameroon | 79.7 /100 | #149 | Good $40,354 |
| Immigrants | Chile | 79.6 /100 | #150 | Good $40,353 |
| Immigrants | Armenia | 79.2 /100 | #151 | Good $40,340 |
| West Indians | 78.4 /100 | #152 | Good $40,317 |
| British West Indians | 77.7 /100 | #153 | Good $40,299 |
Demographics Similar to Immigrants from Mexico by Median Female Earnings
In terms of median female earnings, the demographic groups most similar to Immigrants from Mexico are Tohono O'odham ($33,205, a difference of 0.090%), Immigrants from Cuba ($33,291, a difference of 0.17%), Yakama ($33,354, a difference of 0.36%), Ottawa ($33,378, a difference of 0.43%), and Navajo ($33,046, a difference of 0.57%).
| Demographics | Rating | Rank | Median Female Earnings |
| Choctaw | 0.0 /100 | #332 | Tragic $33,775 |
| Mexicans | 0.0 /100 | #333 | Tragic $33,664 |
| Spanish American Indians | 0.0 /100 | #334 | Tragic $33,625 |
| Creek | 0.0 /100 | #335 | Tragic $33,437 |
| Ottawa | 0.0 /100 | #336 | Tragic $33,378 |
| Yakama | 0.0 /100 | #337 | Tragic $33,354 |
| Immigrants | Cuba | 0.0 /100 | #338 | Tragic $33,291 |
| Immigrants | Mexico | 0.0 /100 | #339 | Tragic $33,236 |
| Tohono O'odham | 0.0 /100 | #340 | Tragic $33,205 |
| Navajo | 0.0 /100 | #341 | Tragic $33,046 |
| Yup'ik | 0.0 /100 | #342 | Tragic $32,730 |
| Pueblo | 0.0 /100 | #343 | Tragic $32,564 |
| Lumbee | 0.0 /100 | #344 | Tragic $32,500 |
| Puerto Ricans | 0.0 /100 | #345 | Tragic $31,560 |
| Arapaho | 0.0 /100 | #346 | Tragic $31,489 |