Ghanaian vs Spanish Unemployment Among Women with Children Under 6 years
COMPARE
Ghanaian
Spanish
Unemployment Among Women with Children Under 6 years
Unemployment Among Women with Children Under 6 years Comparison
Ghanaians
Spanish
8.2%
UNEMPLOYMENT AMONG WOMEN WITH CHILDREN UNDER 6 YEARS
1.0/ 100
METRIC RATING
252nd/ 347
METRIC RANK
7.9%
UNEMPLOYMENT AMONG WOMEN WITH CHILDREN UNDER 6 YEARS
11.3/ 100
METRIC RATING
214th/ 347
METRIC RANK
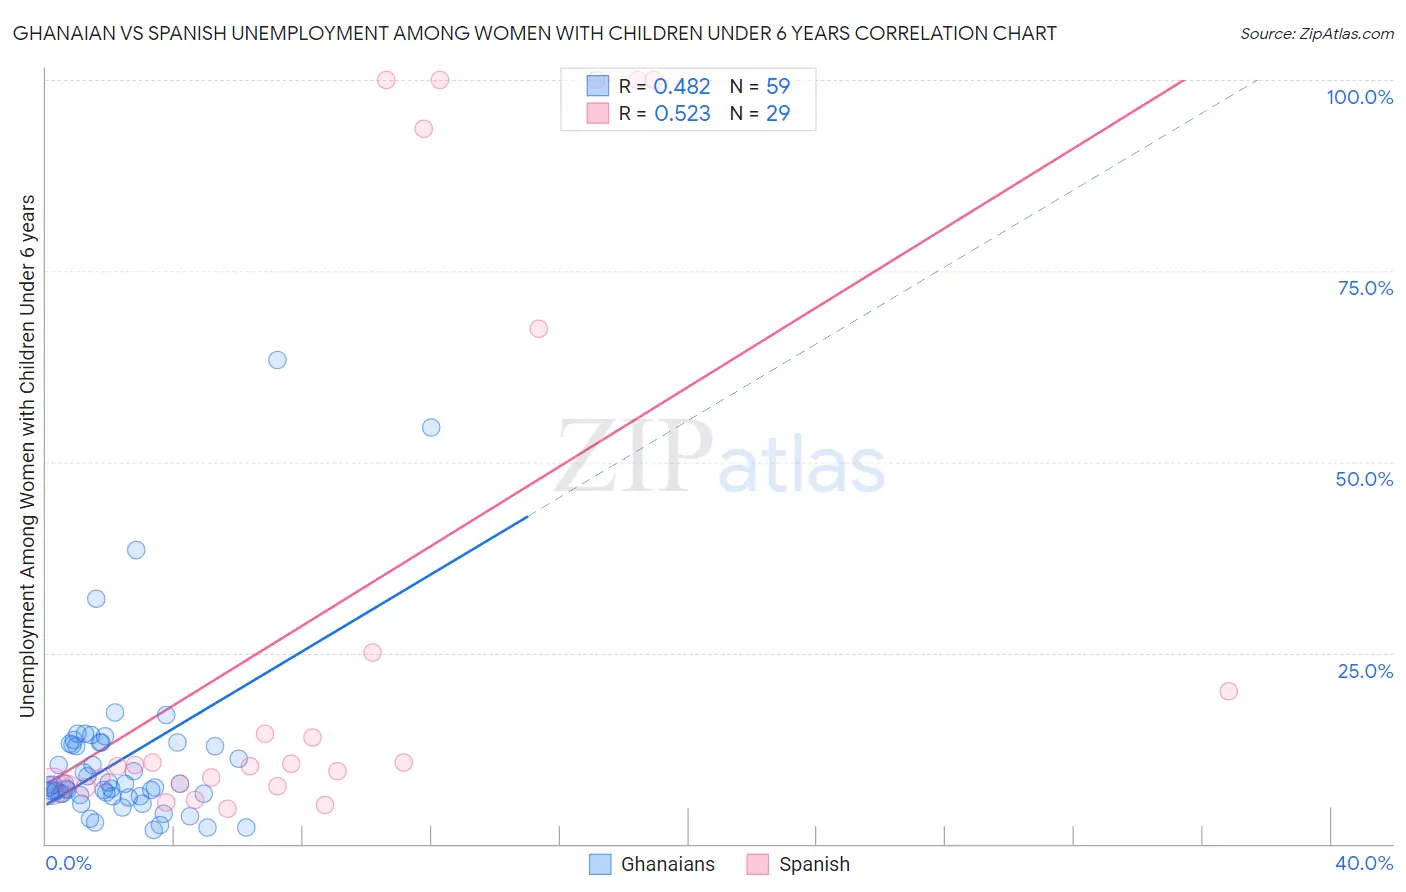
Ghanaian vs Spanish Unemployment Among Women with Children Under 6 years Correlation Chart
The statistical analysis conducted on geographies consisting of 165,389,442 people shows a moderate positive correlation between the proportion of Ghanaians and unemployment rate among women with children under the age of 6 in the United States with a correlation coefficient (R) of 0.482 and weighted average of 8.2%. Similarly, the statistical analysis conducted on geographies consisting of 316,873,283 people shows a substantial positive correlation between the proportion of Spanish and unemployment rate among women with children under the age of 6 in the United States with a correlation coefficient (R) of 0.523 and weighted average of 7.9%, a difference of 4.1%.
Unemployment Among Women with Children Under 6 years Correlation Summary
| Measurement | Ghanaian | Spanish |
| Minimum | 1.8% | 4.6% |
| Maximum | 63.4% | 100.0% |
| Range | 61.6% | 95.4% |
| Mean | 11.0% | 30.4% |
| Median | 7.6% | 10.3% |
| Interquartile 25% (IQ1) | 6.5% | 7.6% |
| Interquartile 75% (IQ3) | 13.2% | 46.3% |
| Interquartile Range (IQR) | 6.7% | 38.6% |
| Standard Deviation (Sample) | 11.0% | 37.4% |
| Standard Deviation (Population) | 10.9% | 36.8% |
Similar Demographics by Unemployment Among Women with Children Under 6 years
Demographics Similar to Ghanaians by Unemployment Among Women with Children Under 6 years
In terms of unemployment among women with children under 6 years, the demographic groups most similar to Ghanaians are Guyanese (8.2%, a difference of 0.0%), Nigerian (8.2%, a difference of 0.17%), Immigrants from Sierra Leone (8.2%, a difference of 0.18%), Immigrants from Guyana (8.2%, a difference of 0.18%), and Immigrants from Western Africa (8.2%, a difference of 0.27%).
| Demographics | Rating | Rank | Unemployment Among Women with Children Under 6 years |
| Native Hawaiians | 1.7 /100 | #245 | Tragic 8.2% |
| Central Americans | 1.4 /100 | #246 | Tragic 8.2% |
| German Russians | 1.2 /100 | #247 | Tragic 8.2% |
| Immigrants | Western Africa | 1.1 /100 | #248 | Tragic 8.2% |
| Immigrants | Sierra Leone | 1.1 /100 | #249 | Tragic 8.2% |
| Nigerians | 1.1 /100 | #250 | Tragic 8.2% |
| Guyanese | 1.0 /100 | #251 | Tragic 8.2% |
| Ghanaians | 1.0 /100 | #252 | Tragic 8.2% |
| Immigrants | Guyana | 0.8 /100 | #253 | Tragic 8.2% |
| Immigrants | Caribbean | 0.7 /100 | #254 | Tragic 8.3% |
| Immigrants | Portugal | 0.6 /100 | #255 | Tragic 8.3% |
| Celtics | 0.6 /100 | #256 | Tragic 8.3% |
| British West Indians | 0.5 /100 | #257 | Tragic 8.3% |
| Immigrants | Ghana | 0.5 /100 | #258 | Tragic 8.3% |
| Barbadians | 0.4 /100 | #259 | Tragic 8.3% |
Demographics Similar to Spanish by Unemployment Among Women with Children Under 6 years
In terms of unemployment among women with children under 6 years, the demographic groups most similar to Spanish are Ecuadorian (7.9%, a difference of 0.010%), Scottish (7.9%, a difference of 0.020%), Immigrants from Lebanon (7.9%, a difference of 0.030%), Immigrants from Nigeria (7.9%, a difference of 0.15%), and Swiss (7.9%, a difference of 0.16%).
| Demographics | Rating | Rank | Unemployment Among Women with Children Under 6 years |
| Canadians | 20.6 /100 | #207 | Fair 7.8% |
| Immigrants | Syria | 18.9 /100 | #208 | Poor 7.8% |
| Costa Ricans | 17.6 /100 | #209 | Poor 7.8% |
| Poles | 16.0 /100 | #210 | Poor 7.9% |
| Immigrants | Ecuador | 14.9 /100 | #211 | Poor 7.9% |
| Swiss | 12.3 /100 | #212 | Poor 7.9% |
| Scottish | 11.4 /100 | #213 | Poor 7.9% |
| Spanish | 11.3 /100 | #214 | Poor 7.9% |
| Ecuadorians | 11.2 /100 | #215 | Poor 7.9% |
| Immigrants | Lebanon | 11.1 /100 | #216 | Poor 7.9% |
| Immigrants | Nigeria | 10.3 /100 | #217 | Poor 7.9% |
| Moroccans | 9.7 /100 | #218 | Tragic 7.9% |
| Arabs | 9.4 /100 | #219 | Tragic 7.9% |
| South American Indians | 9.3 /100 | #220 | Tragic 7.9% |
| Immigrants | Germany | 8.5 /100 | #221 | Tragic 7.9% |