Ghanaian vs Immigrants from Sierra Leone Median Female Earnings
COMPARE
Ghanaian
Immigrants from Sierra Leone
Median Female Earnings
Median Female Earnings Comparison
Ghanaians
Immigrants from Sierra Leone
$40,429
MEDIAN FEMALE EARNINGS
82.1/ 100
METRIC RATING
146th/ 347
METRIC RANK
$42,214
MEDIAN FEMALE EARNINGS
99.5/ 100
METRIC RATING
83rd/ 347
METRIC RANK
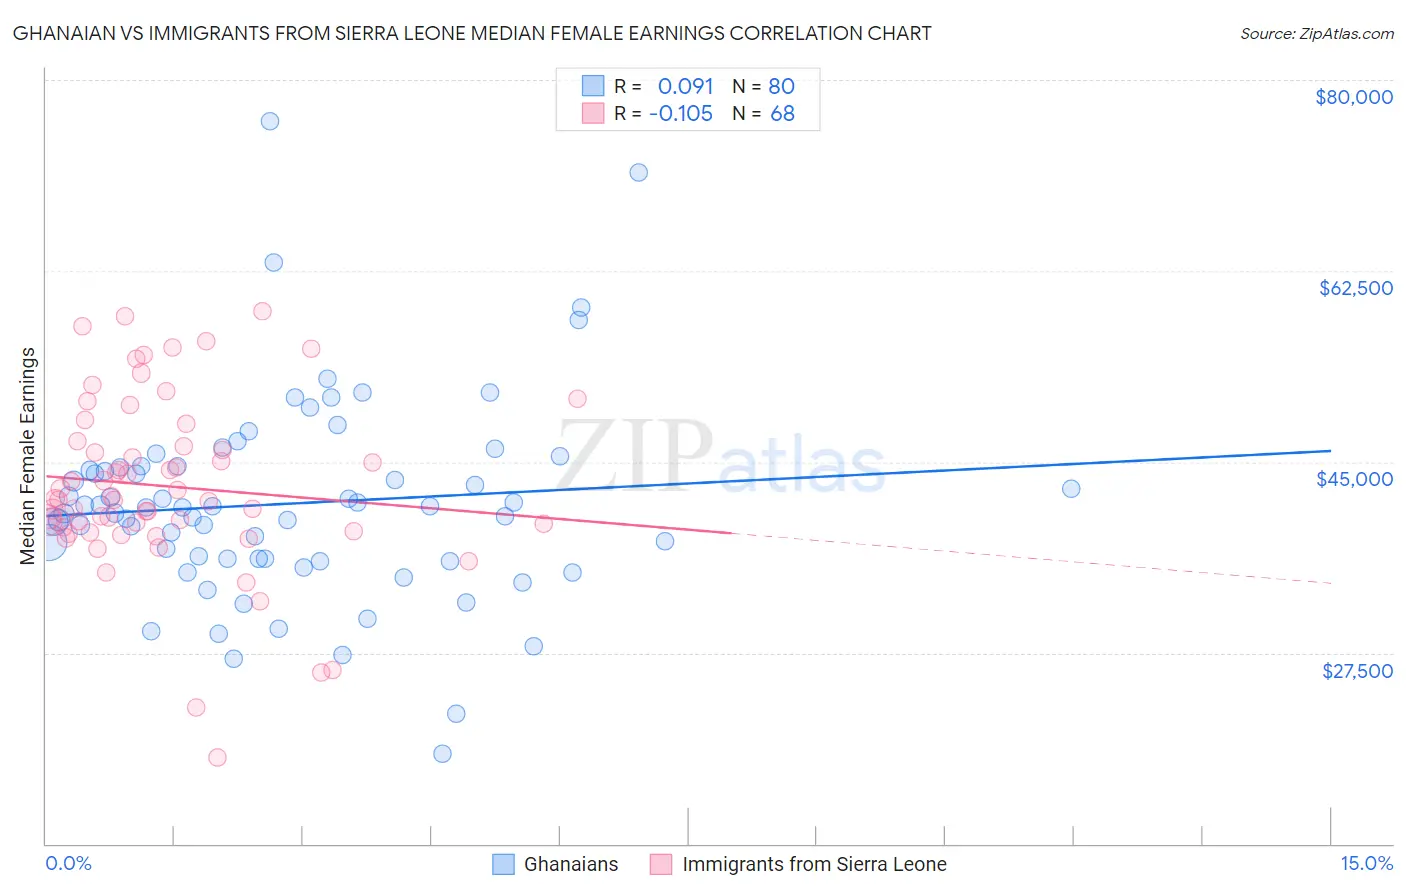
Ghanaian vs Immigrants from Sierra Leone Median Female Earnings Correlation Chart
The statistical analysis conducted on geographies consisting of 190,707,731 people shows a slight positive correlation between the proportion of Ghanaians and median female earnings in the United States with a correlation coefficient (R) of 0.091 and weighted average of $40,429. Similarly, the statistical analysis conducted on geographies consisting of 101,627,832 people shows a poor negative correlation between the proportion of Immigrants from Sierra Leone and median female earnings in the United States with a correlation coefficient (R) of -0.105 and weighted average of $42,214, a difference of 4.4%.
Median Female Earnings Correlation Summary
| Measurement | Ghanaian | Immigrants from Sierra Leone |
| Minimum | $18,266 | $17,869 |
| Maximum | $76,246 | $58,839 |
| Range | $57,980 | $40,970 |
| Mean | $41,171 | $42,763 |
| Median | $40,828 | $41,611 |
| Interquartile 25% (IQ1) | $36,123 | $38,837 |
| Interquartile 75% (IQ3) | $44,535 | $46,686 |
| Interquartile Range (IQR) | $8,413 | $7,849 |
| Standard Deviation (Sample) | $9,292 | $8,036 |
| Standard Deviation (Population) | $9,234 | $7,977 |
Similar Demographics by Median Female Earnings
Demographics Similar to Ghanaians by Median Female Earnings
In terms of median female earnings, the demographic groups most similar to Ghanaians are Brazilian ($40,483, a difference of 0.13%), Vietnamese ($40,377, a difference of 0.13%), Northern European ($40,491, a difference of 0.15%), Immigrants from North Macedonia ($40,488, a difference of 0.15%), and Polish ($40,371, a difference of 0.15%).
| Demographics | Rating | Rank | Median Female Earnings |
| Immigrants | South Eastern Asia | 85.7 /100 | #139 | Excellent $40,558 |
| Serbians | 85.2 /100 | #140 | Excellent $40,539 |
| Immigrants | Syria | 84.1 /100 | #141 | Excellent $40,499 |
| Sri Lankans | 84.0 /100 | #142 | Excellent $40,496 |
| Northern Europeans | 83.9 /100 | #143 | Excellent $40,491 |
| Immigrants | North Macedonia | 83.8 /100 | #144 | Excellent $40,488 |
| Brazilians | 83.6 /100 | #145 | Excellent $40,483 |
| Ghanaians | 82.1 /100 | #146 | Excellent $40,429 |
| Vietnamese | 80.4 /100 | #147 | Excellent $40,377 |
| Poles | 80.2 /100 | #148 | Excellent $40,371 |
| Immigrants | Cameroon | 79.7 /100 | #149 | Good $40,354 |
| Immigrants | Chile | 79.6 /100 | #150 | Good $40,353 |
| Immigrants | Armenia | 79.2 /100 | #151 | Good $40,340 |
| West Indians | 78.4 /100 | #152 | Good $40,317 |
| British West Indians | 77.7 /100 | #153 | Good $40,299 |
Demographics Similar to Immigrants from Sierra Leone by Median Female Earnings
In terms of median female earnings, the demographic groups most similar to Immigrants from Sierra Leone are Armenian ($42,212, a difference of 0.010%), Immigrants from Morocco ($42,229, a difference of 0.030%), Immigrants from Southern Europe ($42,275, a difference of 0.14%), Laotian ($42,133, a difference of 0.19%), and Immigrants from Moldova ($42,304, a difference of 0.21%).
| Demographics | Rating | Rank | Median Female Earnings |
| Immigrants | Italy | 99.7 /100 | #76 | Exceptional $42,446 |
| Immigrants | Albania | 99.6 /100 | #77 | Exceptional $42,388 |
| Immigrants | Kazakhstan | 99.6 /100 | #78 | Exceptional $42,386 |
| Greeks | 99.6 /100 | #79 | Exceptional $42,336 |
| Immigrants | Moldova | 99.6 /100 | #80 | Exceptional $42,304 |
| Immigrants | Southern Europe | 99.5 /100 | #81 | Exceptional $42,275 |
| Immigrants | Morocco | 99.5 /100 | #82 | Exceptional $42,229 |
| Immigrants | Sierra Leone | 99.5 /100 | #83 | Exceptional $42,214 |
| Armenians | 99.5 /100 | #84 | Exceptional $42,212 |
| Laotians | 99.4 /100 | #85 | Exceptional $42,133 |
| Immigrants | St. Vincent and the Grenadines | 99.3 /100 | #86 | Exceptional $42,108 |
| Lithuanians | 99.3 /100 | #87 | Exceptional $42,108 |
| Immigrants | Northern Africa | 99.3 /100 | #88 | Exceptional $42,084 |
| Immigrants | Afghanistan | 99.3 /100 | #89 | Exceptional $42,055 |
| Ukrainians | 99.2 /100 | #90 | Exceptional $42,015 |