French vs Puget Sound Salish Master's Degree
COMPARE
French
Puget Sound Salish
Master's Degree
Master's Degree Comparison
French
Puget Sound Salish
14.4%
MASTER'S DEGREE
23.7/ 100
METRIC RATING
204th/ 347
METRIC RANK
11.1%
MASTER'S DEGREE
0.0/ 100
METRIC RATING
309th/ 347
METRIC RANK
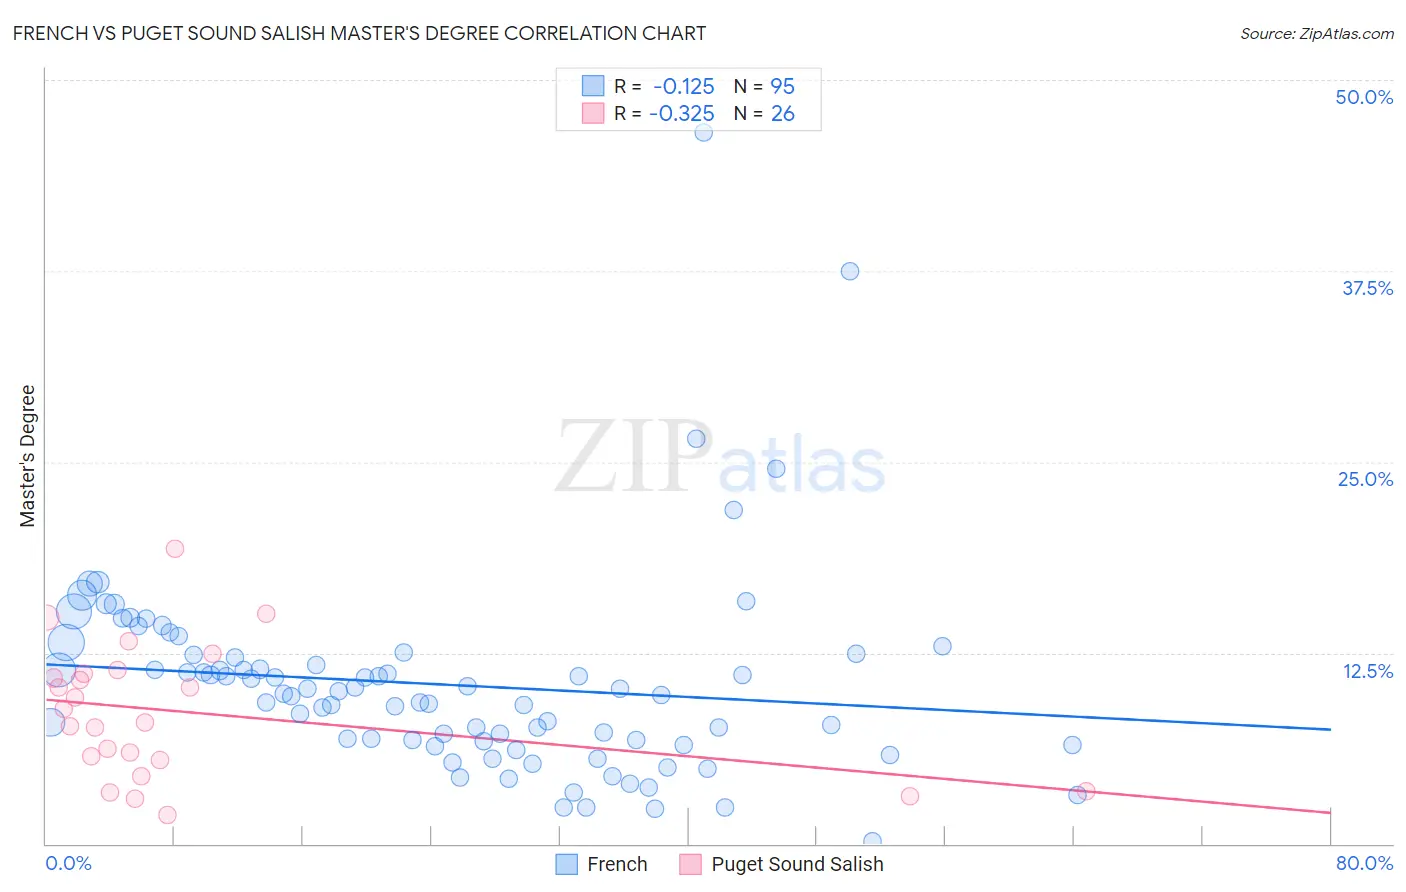
French vs Puget Sound Salish Master's Degree Correlation Chart
The statistical analysis conducted on geographies consisting of 571,581,323 people shows a poor negative correlation between the proportion of French and percentage of population with at least master's degree education in the United States with a correlation coefficient (R) of -0.125 and weighted average of 14.4%. Similarly, the statistical analysis conducted on geographies consisting of 46,155,292 people shows a mild negative correlation between the proportion of Puget Sound Salish and percentage of population with at least master's degree education in the United States with a correlation coefficient (R) of -0.325 and weighted average of 11.1%, a difference of 29.0%.
Master's Degree Correlation Summary
| Measurement | French | Puget Sound Salish |
| Minimum | 0.20% | 1.9% |
| Maximum | 46.6% | 19.3% |
| Range | 46.4% | 17.5% |
| Mean | 10.4% | 8.6% |
| Median | 9.8% | 8.4% |
| Interquartile 25% (IQ1) | 6.7% | 5.5% |
| Interquartile 75% (IQ3) | 12.4% | 11.1% |
| Interquartile Range (IQR) | 5.7% | 5.6% |
| Standard Deviation (Sample) | 6.6% | 4.4% |
| Standard Deviation (Population) | 6.6% | 4.3% |
Similar Demographics by Master's Degree
Demographics Similar to French by Master's Degree
In terms of master's degree, the demographic groups most similar to French are Trinidadian and Tobagonian (14.4%, a difference of 0.030%), Scandinavian (14.4%, a difference of 0.070%), Yugoslavian (14.4%, a difference of 0.11%), Immigrants from Western Africa (14.4%, a difference of 0.22%), and Scotch-Irish (14.4%, a difference of 0.24%).
| Demographics | Rating | Rank | Master's Degree |
| Belgians | 28.0 /100 | #197 | Fair 14.5% |
| West Indians | 27.4 /100 | #198 | Fair 14.5% |
| Immigrants | Armenia | 27.2 /100 | #199 | Fair 14.5% |
| Panamanians | 25.1 /100 | #200 | Fair 14.4% |
| Scotch-Irish | 25.0 /100 | #201 | Fair 14.4% |
| Immigrants | Western Africa | 24.9 /100 | #202 | Fair 14.4% |
| Yugoslavians | 24.3 /100 | #203 | Fair 14.4% |
| French | 23.7 /100 | #204 | Fair 14.4% |
| Trinidadians and Tobagonians | 23.5 /100 | #205 | Fair 14.4% |
| Scandinavians | 23.3 /100 | #206 | Fair 14.4% |
| Immigrants | Bosnia and Herzegovina | 22.0 /100 | #207 | Fair 14.3% |
| Immigrants | Barbados | 20.5 /100 | #208 | Fair 14.3% |
| Immigrants | Panama | 20.0 /100 | #209 | Fair 14.3% |
| Sub-Saharan Africans | 19.4 /100 | #210 | Poor 14.2% |
| Somalis | 18.0 /100 | #211 | Poor 14.2% |
Demographics Similar to Puget Sound Salish by Master's Degree
In terms of master's degree, the demographic groups most similar to Puget Sound Salish are Puerto Rican (11.2%, a difference of 0.29%), Shoshone (11.1%, a difference of 0.36%), Cheyenne (11.2%, a difference of 0.84%), Seminole (11.0%, a difference of 0.87%), and Choctaw (11.0%, a difference of 0.97%).
| Demographics | Rating | Rank | Master's Degree |
| Cherokee | 0.1 /100 | #302 | Tragic 11.4% |
| Immigrants | Laos | 0.1 /100 | #303 | Tragic 11.4% |
| Immigrants | Cabo Verde | 0.1 /100 | #304 | Tragic 11.3% |
| Immigrants | Latin America | 0.0 /100 | #305 | Tragic 11.3% |
| Mexican American Indians | 0.0 /100 | #306 | Tragic 11.2% |
| Cheyenne | 0.0 /100 | #307 | Tragic 11.2% |
| Puerto Ricans | 0.0 /100 | #308 | Tragic 11.2% |
| Puget Sound Salish | 0.0 /100 | #309 | Tragic 11.1% |
| Shoshone | 0.0 /100 | #310 | Tragic 11.1% |
| Seminole | 0.0 /100 | #311 | Tragic 11.0% |
| Choctaw | 0.0 /100 | #312 | Tragic 11.0% |
| Yaqui | 0.0 /100 | #313 | Tragic 11.0% |
| Cajuns | 0.0 /100 | #314 | Tragic 11.0% |
| Apache | 0.0 /100 | #315 | Tragic 11.0% |
| Hispanics or Latinos | 0.0 /100 | #316 | Tragic 10.9% |