French Canadian vs Immigrants from Bosnia and Herzegovina Median Female Earnings
COMPARE
French Canadian
Immigrants from Bosnia and Herzegovina
Median Female Earnings
Median Female Earnings Comparison
French Canadians
Immigrants from Bosnia and Herzegovina
$38,436
MEDIAN FEMALE EARNINGS
6.8/ 100
METRIC RATING
226th/ 347
METRIC RANK
$38,886
MEDIAN FEMALE EARNINGS
15.6/ 100
METRIC RATING
206th/ 347
METRIC RANK
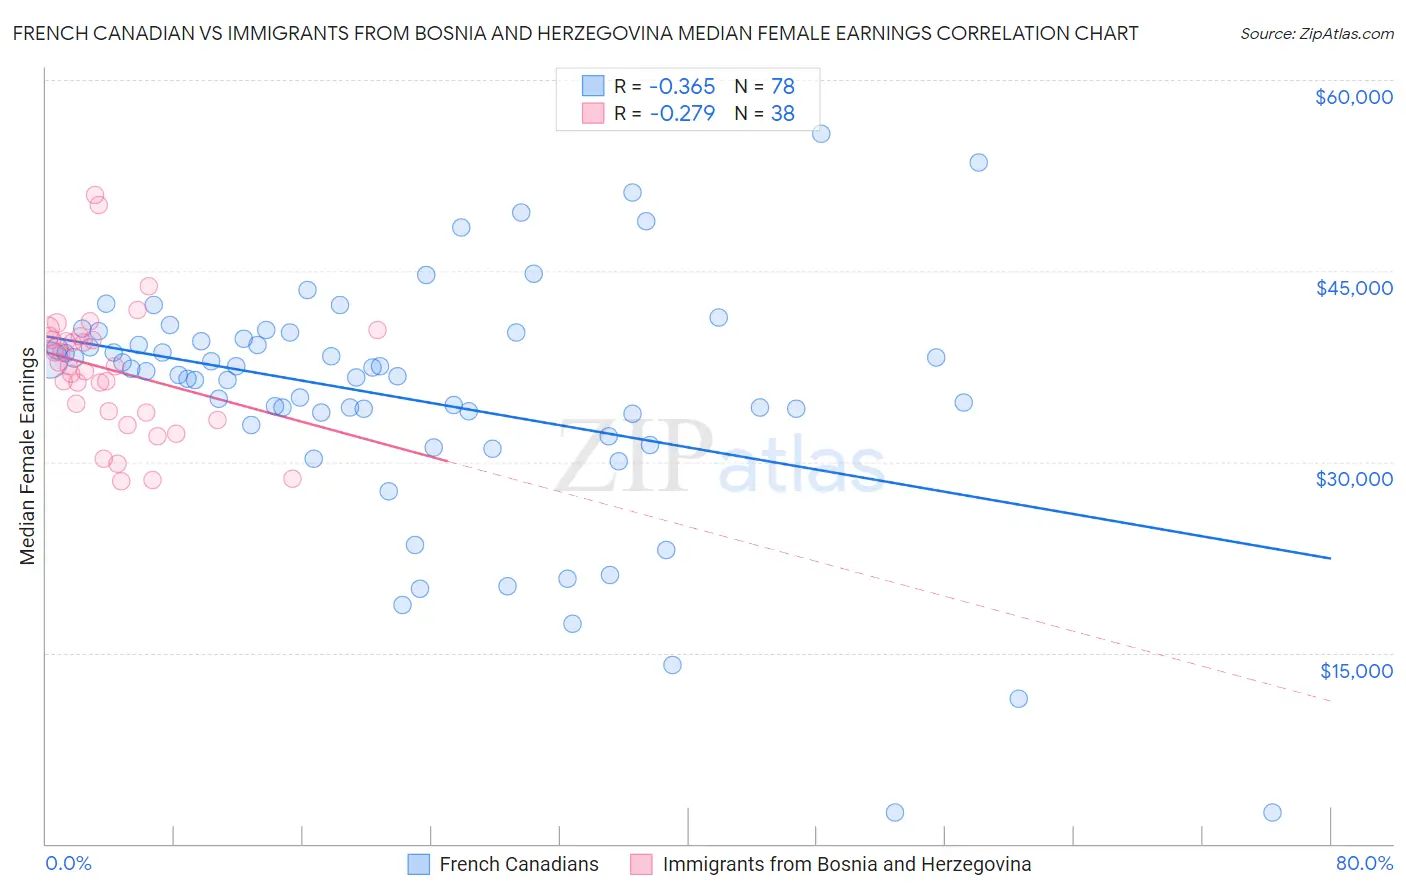
French Canadian vs Immigrants from Bosnia and Herzegovina Median Female Earnings Correlation Chart
The statistical analysis conducted on geographies consisting of 502,023,623 people shows a mild negative correlation between the proportion of French Canadians and median female earnings in the United States with a correlation coefficient (R) of -0.365 and weighted average of $38,436. Similarly, the statistical analysis conducted on geographies consisting of 156,788,843 people shows a weak negative correlation between the proportion of Immigrants from Bosnia and Herzegovina and median female earnings in the United States with a correlation coefficient (R) of -0.279 and weighted average of $38,886, a difference of 1.2%.
Median Female Earnings Correlation Summary
| Measurement | French Canadian | Immigrants from Bosnia and Herzegovina |
| Minimum | $2,499 | $28,455 |
| Maximum | $55,750 | $50,999 |
| Range | $53,251 | $22,544 |
| Mean | $34,934 | $37,228 |
| Median | $37,008 | $37,485 |
| Interquartile 25% (IQ1) | $32,858 | $33,898 |
| Interquartile 75% (IQ3) | $39,682 | $39,866 |
| Interquartile Range (IQR) | $6,824 | $5,968 |
| Standard Deviation (Sample) | $9,847 | $5,099 |
| Standard Deviation (Population) | $9,784 | $5,032 |
Demographics Similar to French Canadians and Immigrants from Bosnia and Herzegovina by Median Female Earnings
In terms of median female earnings, the demographic groups most similar to French Canadians are French ($38,457, a difference of 0.050%), Native Hawaiian ($38,461, a difference of 0.060%), Immigrants from Sudan ($38,511, a difference of 0.20%), Japanese ($38,528, a difference of 0.24%), and Yugoslavian ($38,573, a difference of 0.36%). Similarly, the demographic groups most similar to Immigrants from Bosnia and Herzegovina are Immigrants from Cambodia ($38,833, a difference of 0.14%), Immigrants from Thailand ($38,810, a difference of 0.20%), Norwegian ($38,802, a difference of 0.22%), Czechoslovakian ($38,738, a difference of 0.38%), and Aleut ($38,719, a difference of 0.43%).
| Demographics | Rating | Rank | Median Female Earnings |
| Immigrants | Bosnia and Herzegovina | 15.6 /100 | #206 | Poor $38,886 |
| Immigrants | Cambodia | 14.2 /100 | #207 | Poor $38,833 |
| Immigrants | Thailand | 13.6 /100 | #208 | Poor $38,810 |
| Norwegians | 13.4 /100 | #209 | Poor $38,802 |
| Czechoslovakians | 12.0 /100 | #210 | Poor $38,738 |
| Aleuts | 11.6 /100 | #211 | Poor $38,719 |
| Guamanians/Chamorros | 11.5 /100 | #212 | Poor $38,717 |
| Jamaicans | 10.5 /100 | #213 | Poor $38,670 |
| Iraqis | 10.5 /100 | #214 | Poor $38,666 |
| Spaniards | 10.3 /100 | #215 | Poor $38,656 |
| Immigrants | Ecuador | 10.1 /100 | #216 | Poor $38,644 |
| Immigrants | Jamaica | 9.7 /100 | #217 | Tragic $38,625 |
| Cape Verdeans | 9.5 /100 | #218 | Tragic $38,614 |
| Nepalese | 9.3 /100 | #219 | Tragic $38,603 |
| Yugoslavians | 8.8 /100 | #220 | Tragic $38,573 |
| Immigrants | Azores | 8.8 /100 | #221 | Tragic $38,573 |
| Japanese | 8.1 /100 | #222 | Tragic $38,528 |
| Immigrants | Sudan | 7.8 /100 | #223 | Tragic $38,511 |
| Native Hawaiians | 7.1 /100 | #224 | Tragic $38,461 |
| French | 7.0 /100 | #225 | Tragic $38,457 |
| French Canadians | 6.8 /100 | #226 | Tragic $38,436 |