Immigrants from Liberia vs Immigrants from Bosnia and Herzegovina Median Female Earnings
COMPARE
Immigrants from Liberia
Immigrants from Bosnia and Herzegovina
Median Female Earnings
Median Female Earnings Comparison
Immigrants from Liberia
Immigrants from Bosnia and Herzegovina
$37,970
MEDIAN FEMALE EARNINGS
2.7/ 100
METRIC RATING
244th/ 347
METRIC RANK
$38,886
MEDIAN FEMALE EARNINGS
15.6/ 100
METRIC RATING
206th/ 347
METRIC RANK
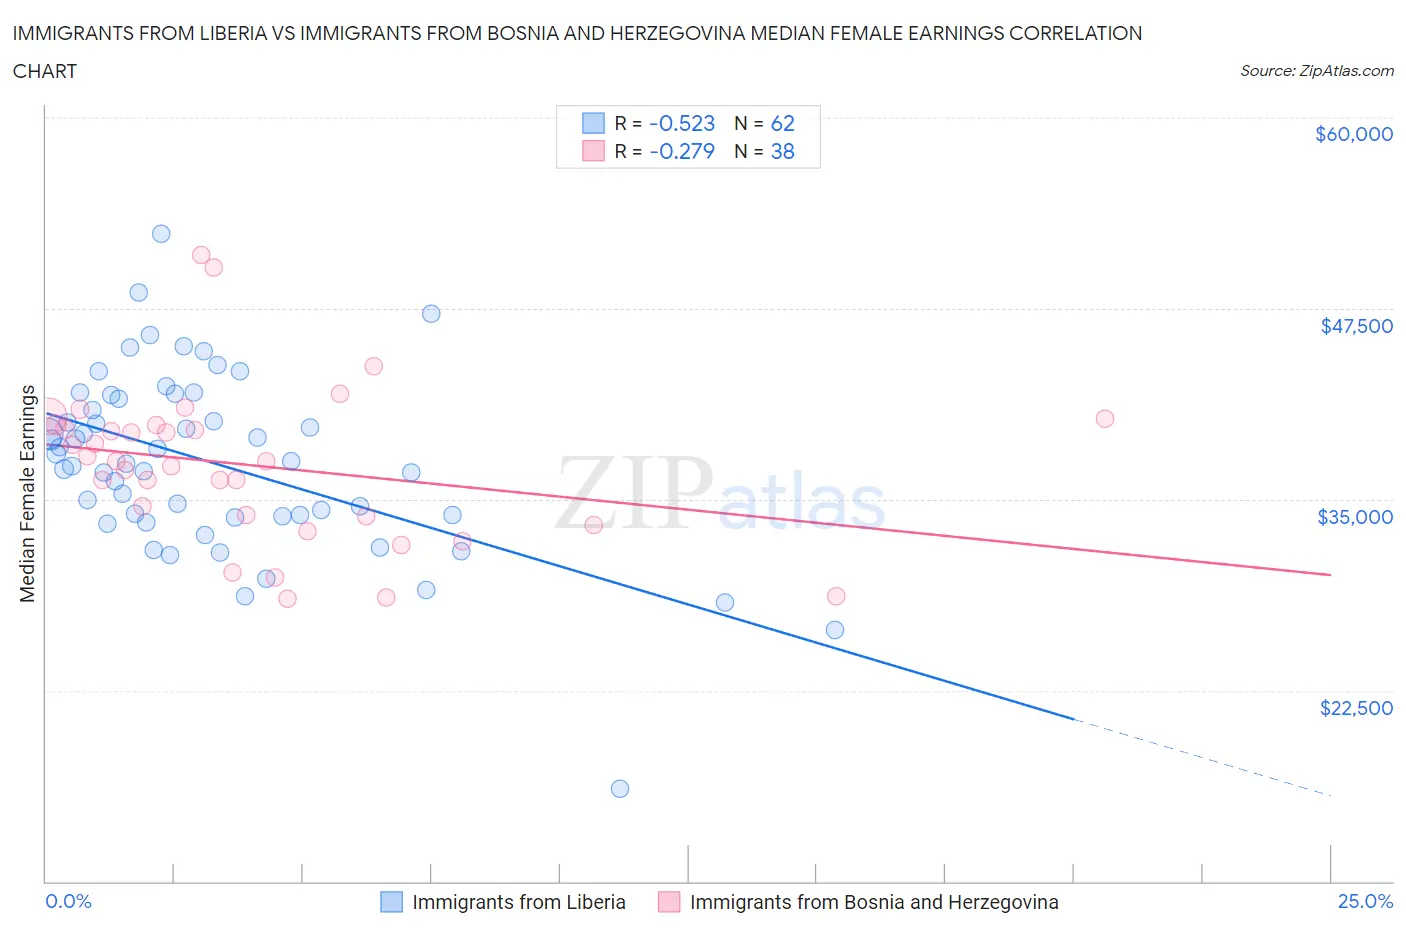
Immigrants from Liberia vs Immigrants from Bosnia and Herzegovina Median Female Earnings Correlation Chart
The statistical analysis conducted on geographies consisting of 135,268,038 people shows a substantial negative correlation between the proportion of Immigrants from Liberia and median female earnings in the United States with a correlation coefficient (R) of -0.523 and weighted average of $37,970. Similarly, the statistical analysis conducted on geographies consisting of 156,788,843 people shows a weak negative correlation between the proportion of Immigrants from Bosnia and Herzegovina and median female earnings in the United States with a correlation coefficient (R) of -0.279 and weighted average of $38,886, a difference of 2.4%.
Median Female Earnings Correlation Summary
| Measurement | Immigrants from Liberia | Immigrants from Bosnia and Herzegovina |
| Minimum | $16,076 | $28,455 |
| Maximum | $52,381 | $50,999 |
| Range | $36,305 | $22,544 |
| Mean | $37,357 | $37,228 |
| Median | $37,425 | $37,485 |
| Interquartile 25% (IQ1) | $33,898 | $33,898 |
| Interquartile 75% (IQ3) | $41,557 | $39,866 |
| Interquartile Range (IQR) | $7,659 | $5,968 |
| Standard Deviation (Sample) | $5,953 | $5,099 |
| Standard Deviation (Population) | $5,904 | $5,032 |
Similar Demographics by Median Female Earnings
Demographics Similar to Immigrants from Liberia by Median Female Earnings
In terms of median female earnings, the demographic groups most similar to Immigrants from Liberia are Immigrants from Middle Africa ($37,965, a difference of 0.010%), Delaware ($37,964, a difference of 0.010%), German ($37,986, a difference of 0.040%), Immigrants from Burma/Myanmar ($38,028, a difference of 0.15%), and Immigrants from Somalia ($37,914, a difference of 0.15%).
| Demographics | Rating | Rank | Median Female Earnings |
| Immigrants | Cabo Verde | 4.3 /100 | #237 | Tragic $38,208 |
| Alaska Natives | 4.3 /100 | #238 | Tragic $38,202 |
| English | 4.2 /100 | #239 | Tragic $38,196 |
| Finns | 4.0 /100 | #240 | Tragic $38,173 |
| Spanish | 3.5 /100 | #241 | Tragic $38,098 |
| Immigrants | Burma/Myanmar | 3.0 /100 | #242 | Tragic $38,028 |
| Germans | 2.8 /100 | #243 | Tragic $37,986 |
| Immigrants | Liberia | 2.7 /100 | #244 | Tragic $37,970 |
| Immigrants | Middle Africa | 2.7 /100 | #245 | Tragic $37,965 |
| Delaware | 2.6 /100 | #246 | Tragic $37,964 |
| Immigrants | Somalia | 2.4 /100 | #247 | Tragic $37,914 |
| Alaskan Athabascans | 2.3 /100 | #248 | Tragic $37,905 |
| Swiss | 2.3 /100 | #249 | Tragic $37,904 |
| Immigrants | Iraq | 2.2 /100 | #250 | Tragic $37,864 |
| Welsh | 2.1 /100 | #251 | Tragic $37,856 |
Demographics Similar to Immigrants from Bosnia and Herzegovina by Median Female Earnings
In terms of median female earnings, the demographic groups most similar to Immigrants from Bosnia and Herzegovina are Immigrants from Colombia ($38,913, a difference of 0.070%), Immigrants from Cambodia ($38,833, a difference of 0.14%), Immigrants from Uruguay ($38,945, a difference of 0.15%), Immigrants from Thailand ($38,810, a difference of 0.20%), and Norwegian ($38,802, a difference of 0.22%).
| Demographics | Rating | Rank | Median Female Earnings |
| Icelanders | 22.7 /100 | #199 | Fair $39,109 |
| Immigrants | Panama | 20.6 /100 | #200 | Fair $39,049 |
| Panamanians | 20.6 /100 | #201 | Fair $39,049 |
| Slovaks | 19.9 /100 | #202 | Poor $39,029 |
| Czechs | 18.7 /100 | #203 | Poor $38,992 |
| Immigrants | Uruguay | 17.3 /100 | #204 | Poor $38,945 |
| Immigrants | Colombia | 16.3 /100 | #205 | Poor $38,913 |
| Immigrants | Bosnia and Herzegovina | 15.6 /100 | #206 | Poor $38,886 |
| Immigrants | Cambodia | 14.2 /100 | #207 | Poor $38,833 |
| Immigrants | Thailand | 13.6 /100 | #208 | Poor $38,810 |
| Norwegians | 13.4 /100 | #209 | Poor $38,802 |
| Czechoslovakians | 12.0 /100 | #210 | Poor $38,738 |
| Aleuts | 11.6 /100 | #211 | Poor $38,719 |
| Guamanians/Chamorros | 11.5 /100 | #212 | Poor $38,717 |
| Jamaicans | 10.5 /100 | #213 | Poor $38,670 |