French Canadian vs Immigrants from Bosnia and Herzegovina Unemployment Among Women with Children Under 6 years
COMPARE
French Canadian
Immigrants from Bosnia and Herzegovina
Unemployment Among Women with Children Under 6 years
Unemployment Among Women with Children Under 6 years Comparison
French Canadians
Immigrants from Bosnia and Herzegovina
8.4%
UNEMPLOYMENT AMONG WOMEN WITH CHILDREN UNDER 6 YEARS
0.3/ 100
METRIC RATING
265th/ 347
METRIC RANK
7.3%
UNEMPLOYMENT AMONG WOMEN WITH CHILDREN UNDER 6 YEARS
93.5/ 100
METRIC RATING
122nd/ 347
METRIC RANK
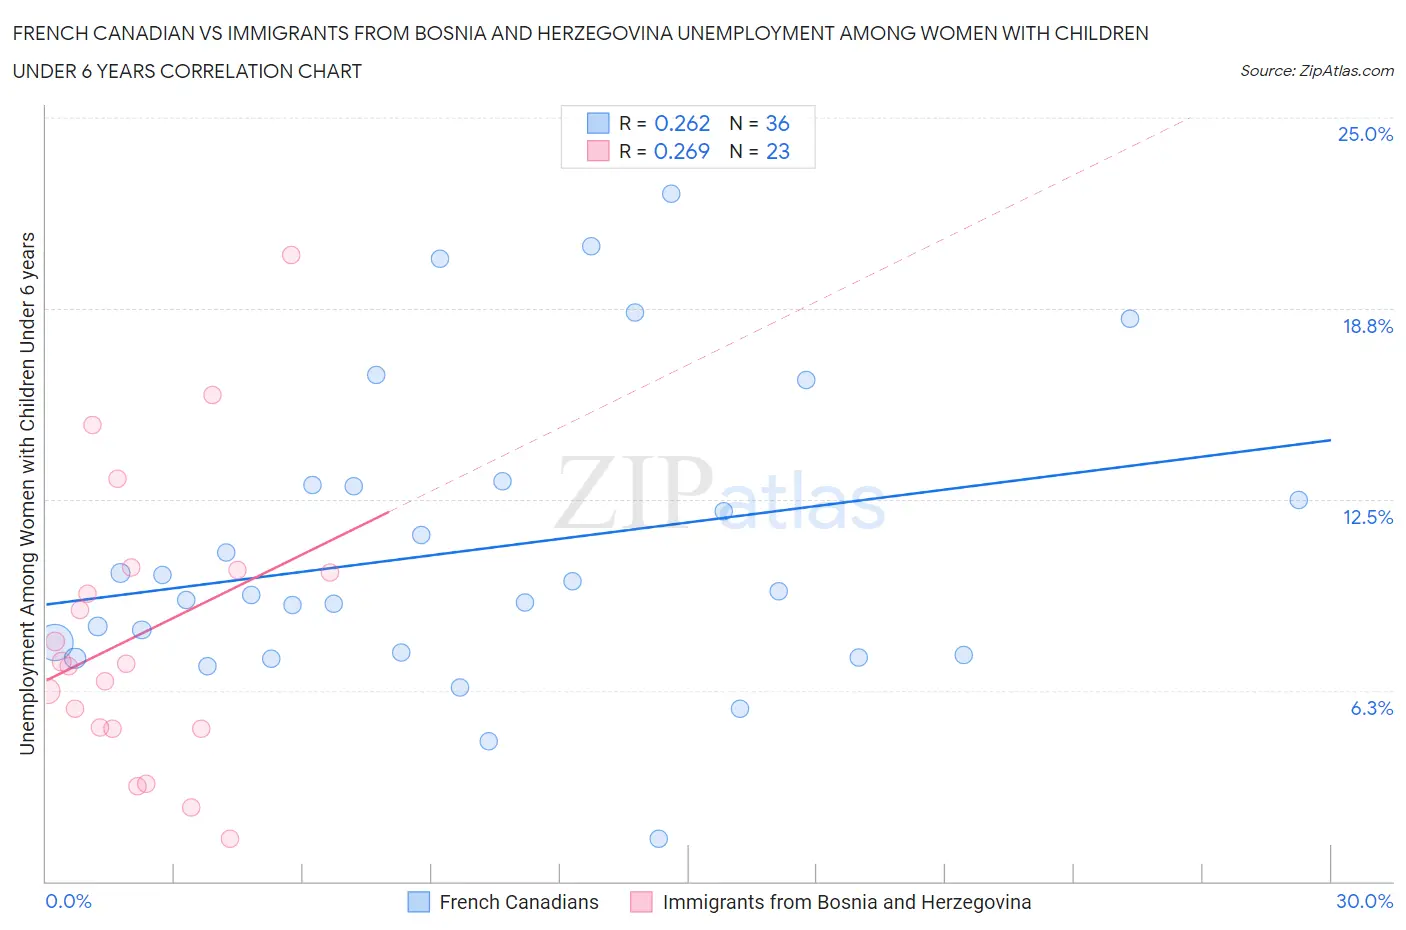
French Canadian vs Immigrants from Bosnia and Herzegovina Unemployment Among Women with Children Under 6 years Correlation Chart
The statistical analysis conducted on geographies consisting of 347,734,742 people shows a weak positive correlation between the proportion of French Canadians and unemployment rate among women with children under the age of 6 in the United States with a correlation coefficient (R) of 0.262 and weighted average of 8.4%. Similarly, the statistical analysis conducted on geographies consisting of 133,857,807 people shows a weak positive correlation between the proportion of Immigrants from Bosnia and Herzegovina and unemployment rate among women with children under the age of 6 in the United States with a correlation coefficient (R) of 0.269 and weighted average of 7.3%, a difference of 14.9%.
Unemployment Among Women with Children Under 6 years Correlation Summary
| Measurement | French Canadian | Immigrants from Bosnia and Herzegovina |
| Minimum | 1.4% | 1.4% |
| Maximum | 22.5% | 20.5% |
| Range | 21.1% | 19.1% |
| Mean | 10.9% | 8.1% |
| Median | 9.4% | 7.1% |
| Interquartile 25% (IQ1) | 7.4% | 5.0% |
| Interquartile 75% (IQ3) | 13.0% | 10.2% |
| Interquartile Range (IQR) | 5.5% | 5.2% |
| Standard Deviation (Sample) | 4.8% | 4.6% |
| Standard Deviation (Population) | 4.8% | 4.5% |
Similar Demographics by Unemployment Among Women with Children Under 6 years
Demographics Similar to French Canadians by Unemployment Among Women with Children Under 6 years
In terms of unemployment among women with children under 6 years, the demographic groups most similar to French Canadians are Immigrants from Honduras (8.4%, a difference of 0.0%), Honduran (8.4%, a difference of 0.050%), Scotch-Irish (8.4%, a difference of 0.070%), West Indian (8.4%, a difference of 0.10%), and Immigrants from Liberia (8.4%, a difference of 0.11%).
| Demographics | Rating | Rank | Unemployment Among Women with Children Under 6 years |
| Immigrants | Ghana | 0.5 /100 | #258 | Tragic 8.3% |
| Barbadians | 0.4 /100 | #259 | Tragic 8.3% |
| Whites/Caucasians | 0.3 /100 | #260 | Tragic 8.4% |
| Immigrants | Liberia | 0.3 /100 | #261 | Tragic 8.4% |
| West Indians | 0.3 /100 | #262 | Tragic 8.4% |
| Scotch-Irish | 0.3 /100 | #263 | Tragic 8.4% |
| Hondurans | 0.3 /100 | #264 | Tragic 8.4% |
| French Canadians | 0.3 /100 | #265 | Tragic 8.4% |
| Immigrants | Honduras | 0.3 /100 | #266 | Tragic 8.4% |
| Belizeans | 0.2 /100 | #267 | Tragic 8.4% |
| Sub-Saharan Africans | 0.2 /100 | #268 | Tragic 8.4% |
| Immigrants | Haiti | 0.2 /100 | #269 | Tragic 8.4% |
| Immigrants | Senegal | 0.2 /100 | #270 | Tragic 8.5% |
| Immigrants | Congo | 0.2 /100 | #271 | Tragic 8.5% |
| Mexican American Indians | 0.1 /100 | #272 | Tragic 8.5% |
Demographics Similar to Immigrants from Bosnia and Herzegovina by Unemployment Among Women with Children Under 6 years
In terms of unemployment among women with children under 6 years, the demographic groups most similar to Immigrants from Bosnia and Herzegovina are Immigrants from Chile (7.3%, a difference of 0.010%), Immigrants from Zaire (7.3%, a difference of 0.050%), Iraqi (7.3%, a difference of 0.13%), South African (7.3%, a difference of 0.20%), and Immigrants from South Africa (7.3%, a difference of 0.25%).
| Demographics | Rating | Rank | Unemployment Among Women with Children Under 6 years |
| Immigrants | Italy | 96.1 /100 | #115 | Exceptional 7.2% |
| Armenians | 95.9 /100 | #116 | Exceptional 7.2% |
| Immigrants | Kenya | 95.4 /100 | #117 | Exceptional 7.3% |
| Serbians | 94.5 /100 | #118 | Exceptional 7.3% |
| South Africans | 94.1 /100 | #119 | Exceptional 7.3% |
| Iraqis | 93.9 /100 | #120 | Exceptional 7.3% |
| Immigrants | Chile | 93.5 /100 | #121 | Exceptional 7.3% |
| Immigrants | Bosnia and Herzegovina | 93.5 /100 | #122 | Exceptional 7.3% |
| Immigrants | Zaire | 93.3 /100 | #123 | Exceptional 7.3% |
| Immigrants | South Africa | 92.5 /100 | #124 | Exceptional 7.3% |
| Pakistanis | 92.2 /100 | #125 | Exceptional 7.3% |
| Immigrants | Burma/Myanmar | 91.9 /100 | #126 | Exceptional 7.3% |
| Jordanians | 91.5 /100 | #127 | Exceptional 7.3% |
| Zimbabweans | 91.5 /100 | #128 | Exceptional 7.3% |
| Slovenes | 89.2 /100 | #129 | Excellent 7.4% |