Immigrants from Japan vs Immigrants from Bosnia and Herzegovina Median Female Earnings
COMPARE
Immigrants from Japan
Immigrants from Bosnia and Herzegovina
Median Female Earnings
Median Female Earnings Comparison
Immigrants from Japan
Immigrants from Bosnia and Herzegovina
$45,323
MEDIAN FEMALE EARNINGS
100.0/ 100
METRIC RATING
20th/ 347
METRIC RANK
$38,886
MEDIAN FEMALE EARNINGS
15.6/ 100
METRIC RATING
206th/ 347
METRIC RANK
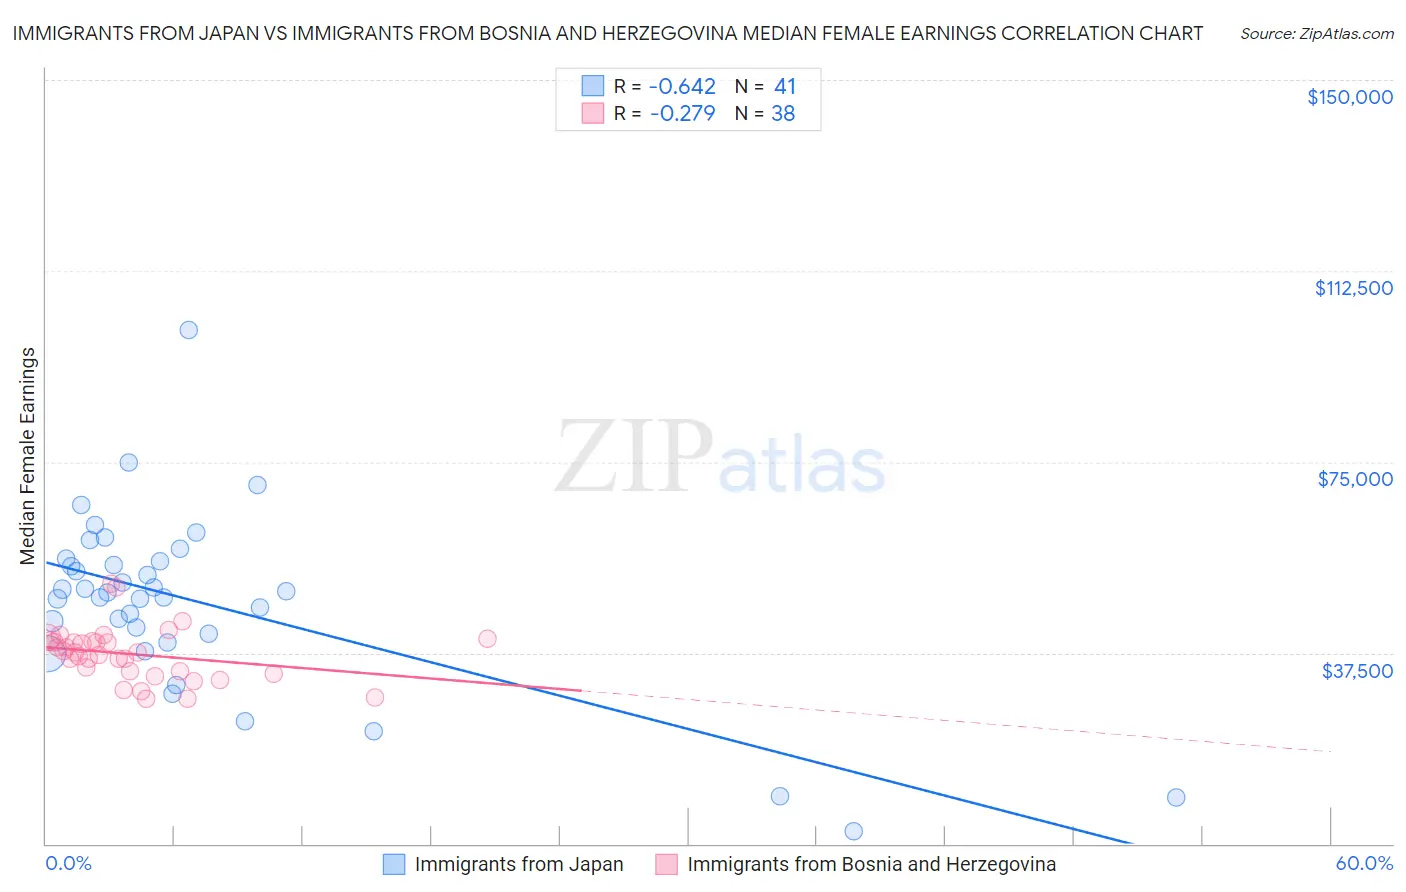
Immigrants from Japan vs Immigrants from Bosnia and Herzegovina Median Female Earnings Correlation Chart
The statistical analysis conducted on geographies consisting of 340,067,986 people shows a significant negative correlation between the proportion of Immigrants from Japan and median female earnings in the United States with a correlation coefficient (R) of -0.642 and weighted average of $45,323. Similarly, the statistical analysis conducted on geographies consisting of 156,788,843 people shows a weak negative correlation between the proportion of Immigrants from Bosnia and Herzegovina and median female earnings in the United States with a correlation coefficient (R) of -0.279 and weighted average of $38,886, a difference of 16.6%.
Median Female Earnings Correlation Summary
| Measurement | Immigrants from Japan | Immigrants from Bosnia and Herzegovina |
| Minimum | $2,499 | $28,455 |
| Maximum | $100,821 | $50,999 |
| Range | $98,322 | $22,544 |
| Mean | $47,310 | $37,228 |
| Median | $49,462 | $37,485 |
| Interquartile 25% (IQ1) | $40,316 | $33,898 |
| Interquartile 75% (IQ3) | $55,693 | $39,866 |
| Interquartile Range (IQR) | $15,376 | $5,968 |
| Standard Deviation (Sample) | $17,852 | $5,099 |
| Standard Deviation (Population) | $17,633 | $5,032 |
Similar Demographics by Median Female Earnings
Demographics Similar to Immigrants from Japan by Median Female Earnings
In terms of median female earnings, the demographic groups most similar to Immigrants from Japan are Eastern European ($45,385, a difference of 0.14%), Cypriot ($45,570, a difference of 0.55%), Cambodian ($45,014, a difference of 0.69%), Immigrants from Greece ($44,976, a difference of 0.77%), and Burmese ($44,911, a difference of 0.92%).
| Demographics | Rating | Rank | Median Female Earnings |
| Immigrants | Australia | 100.0 /100 | #13 | Exceptional $46,573 |
| Soviet Union | 100.0 /100 | #14 | Exceptional $46,556 |
| Immigrants | Eastern Asia | 100.0 /100 | #15 | Exceptional $46,502 |
| Indians (Asian) | 100.0 /100 | #16 | Exceptional $46,481 |
| Immigrants | South Central Asia | 100.0 /100 | #17 | Exceptional $46,324 |
| Cypriots | 100.0 /100 | #18 | Exceptional $45,570 |
| Eastern Europeans | 100.0 /100 | #19 | Exceptional $45,385 |
| Immigrants | Japan | 100.0 /100 | #20 | Exceptional $45,323 |
| Cambodians | 100.0 /100 | #21 | Exceptional $45,014 |
| Immigrants | Greece | 100.0 /100 | #22 | Exceptional $44,976 |
| Burmese | 100.0 /100 | #23 | Exceptional $44,911 |
| Immigrants | Korea | 100.0 /100 | #24 | Exceptional $44,847 |
| Immigrants | Sweden | 100.0 /100 | #25 | Exceptional $44,774 |
| Immigrants | Belarus | 100.0 /100 | #26 | Exceptional $44,757 |
| Turks | 100.0 /100 | #27 | Exceptional $44,695 |
Demographics Similar to Immigrants from Bosnia and Herzegovina by Median Female Earnings
In terms of median female earnings, the demographic groups most similar to Immigrants from Bosnia and Herzegovina are Immigrants from Colombia ($38,913, a difference of 0.070%), Immigrants from Cambodia ($38,833, a difference of 0.14%), Immigrants from Uruguay ($38,945, a difference of 0.15%), Immigrants from Thailand ($38,810, a difference of 0.20%), and Norwegian ($38,802, a difference of 0.22%).
| Demographics | Rating | Rank | Median Female Earnings |
| Icelanders | 22.7 /100 | #199 | Fair $39,109 |
| Immigrants | Panama | 20.6 /100 | #200 | Fair $39,049 |
| Panamanians | 20.6 /100 | #201 | Fair $39,049 |
| Slovaks | 19.9 /100 | #202 | Poor $39,029 |
| Czechs | 18.7 /100 | #203 | Poor $38,992 |
| Immigrants | Uruguay | 17.3 /100 | #204 | Poor $38,945 |
| Immigrants | Colombia | 16.3 /100 | #205 | Poor $38,913 |
| Immigrants | Bosnia and Herzegovina | 15.6 /100 | #206 | Poor $38,886 |
| Immigrants | Cambodia | 14.2 /100 | #207 | Poor $38,833 |
| Immigrants | Thailand | 13.6 /100 | #208 | Poor $38,810 |
| Norwegians | 13.4 /100 | #209 | Poor $38,802 |
| Czechoslovakians | 12.0 /100 | #210 | Poor $38,738 |
| Aleuts | 11.6 /100 | #211 | Poor $38,719 |
| Guamanians/Chamorros | 11.5 /100 | #212 | Poor $38,717 |
| Jamaicans | 10.5 /100 | #213 | Poor $38,670 |