French Canadian vs Jordanian Median Female Earnings
COMPARE
French Canadian
Jordanian
Median Female Earnings
Median Female Earnings Comparison
French Canadians
Jordanians
$38,436
MEDIAN FEMALE EARNINGS
6.8/ 100
METRIC RATING
226th/ 347
METRIC RANK
$41,464
MEDIAN FEMALE EARNINGS
97.5/ 100
METRIC RATING
108th/ 347
METRIC RANK
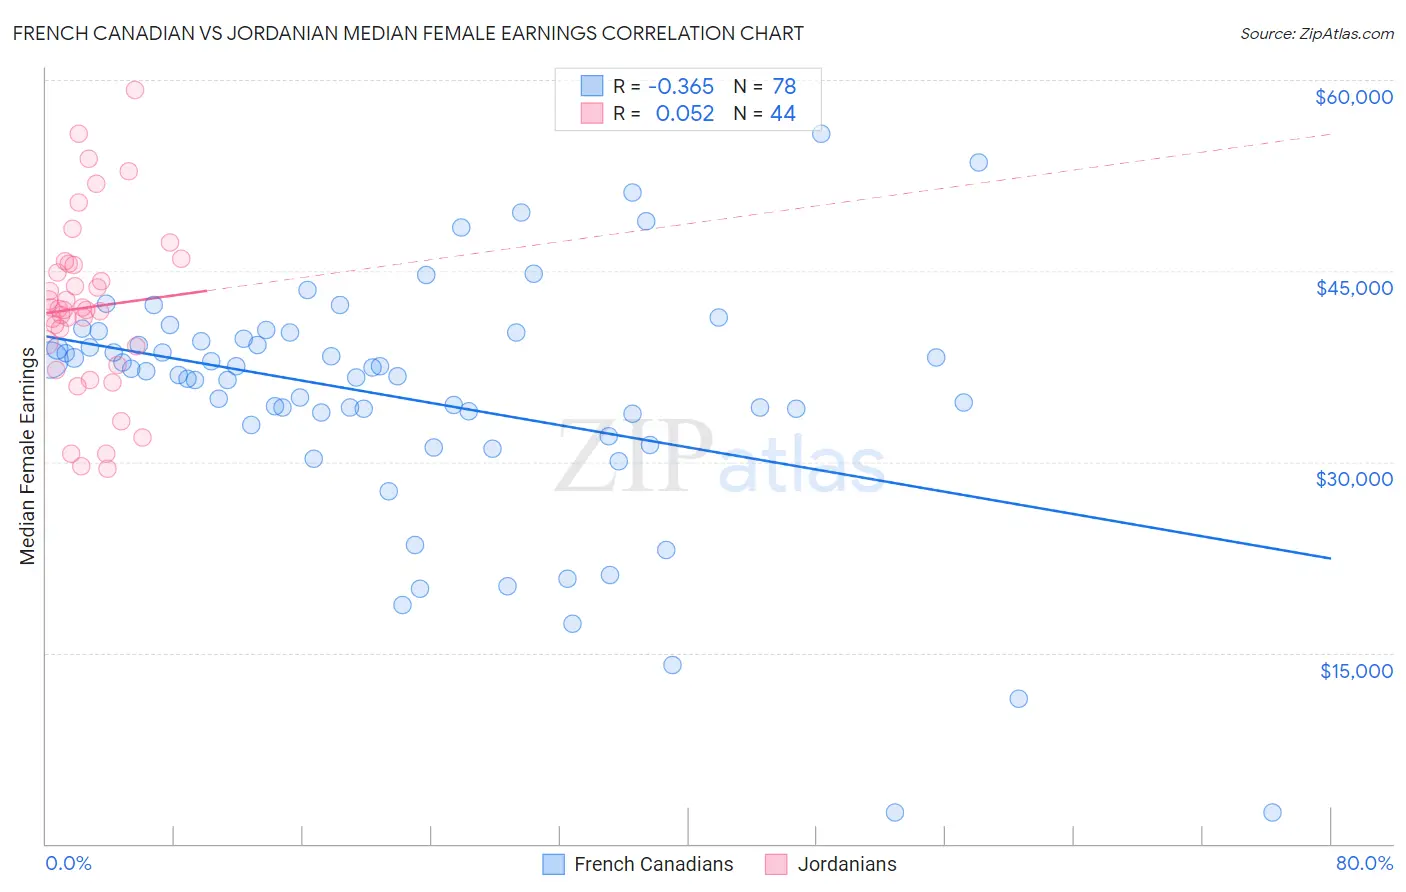
French Canadian vs Jordanian Median Female Earnings Correlation Chart
The statistical analysis conducted on geographies consisting of 502,023,623 people shows a mild negative correlation between the proportion of French Canadians and median female earnings in the United States with a correlation coefficient (R) of -0.365 and weighted average of $38,436. Similarly, the statistical analysis conducted on geographies consisting of 166,394,093 people shows a slight positive correlation between the proportion of Jordanians and median female earnings in the United States with a correlation coefficient (R) of 0.052 and weighted average of $41,464, a difference of 7.9%.
Median Female Earnings Correlation Summary
| Measurement | French Canadian | Jordanian |
| Minimum | $2,499 | $29,450 |
| Maximum | $55,750 | $59,183 |
| Range | $53,251 | $29,733 |
| Mean | $34,934 | $42,125 |
| Median | $37,008 | $41,963 |
| Interquartile 25% (IQ1) | $32,858 | $38,328 |
| Interquartile 75% (IQ3) | $39,682 | $45,509 |
| Interquartile Range (IQR) | $6,824 | $7,181 |
| Standard Deviation (Sample) | $9,847 | $6,763 |
| Standard Deviation (Population) | $9,784 | $6,685 |
Similar Demographics by Median Female Earnings
Demographics Similar to French Canadians by Median Female Earnings
In terms of median female earnings, the demographic groups most similar to French Canadians are French ($38,457, a difference of 0.050%), Native Hawaiian ($38,461, a difference of 0.060%), Scottish ($38,397, a difference of 0.10%), Subsaharan African ($38,391, a difference of 0.12%), and Belgian ($38,382, a difference of 0.14%).
| Demographics | Rating | Rank | Median Female Earnings |
| Nepalese | 9.3 /100 | #219 | Tragic $38,603 |
| Yugoslavians | 8.8 /100 | #220 | Tragic $38,573 |
| Immigrants | Azores | 8.8 /100 | #221 | Tragic $38,573 |
| Japanese | 8.1 /100 | #222 | Tragic $38,528 |
| Immigrants | Sudan | 7.8 /100 | #223 | Tragic $38,511 |
| Native Hawaiians | 7.1 /100 | #224 | Tragic $38,461 |
| French | 7.0 /100 | #225 | Tragic $38,457 |
| French Canadians | 6.8 /100 | #226 | Tragic $38,436 |
| Scottish | 6.3 /100 | #227 | Tragic $38,397 |
| Sub-Saharan Africans | 6.2 /100 | #228 | Tragic $38,391 |
| Belgians | 6.1 /100 | #229 | Tragic $38,382 |
| Basques | 5.7 /100 | #230 | Tragic $38,352 |
| Somalis | 5.5 /100 | #231 | Tragic $38,333 |
| Scandinavians | 5.2 /100 | #232 | Tragic $38,306 |
| Tongans | 5.1 /100 | #233 | Tragic $38,288 |
Demographics Similar to Jordanians by Median Female Earnings
In terms of median female earnings, the demographic groups most similar to Jordanians are Chinese ($41,461, a difference of 0.010%), Immigrants from Eritrea ($41,485, a difference of 0.050%), Palestinian ($41,484, a difference of 0.050%), Italian ($41,505, a difference of 0.10%), and Immigrants from Zimbabwe ($41,527, a difference of 0.15%).
| Demographics | Rating | Rank | Median Female Earnings |
| Immigrants | Fiji | 98.3 /100 | #101 | Exceptional $41,656 |
| Immigrants | Poland | 98.2 /100 | #102 | Exceptional $41,630 |
| Immigrants | Argentina | 97.9 /100 | #103 | Exceptional $41,554 |
| Immigrants | Zimbabwe | 97.8 /100 | #104 | Exceptional $41,527 |
| Italians | 97.7 /100 | #105 | Exceptional $41,505 |
| Immigrants | Eritrea | 97.6 /100 | #106 | Exceptional $41,485 |
| Palestinians | 97.6 /100 | #107 | Exceptional $41,484 |
| Jordanians | 97.5 /100 | #108 | Exceptional $41,464 |
| Chinese | 97.5 /100 | #109 | Exceptional $41,461 |
| Immigrants | Western Asia | 97.0 /100 | #110 | Exceptional $41,375 |
| Immigrants | Canada | 97.0 /100 | #111 | Exceptional $41,373 |
| Immigrants | North America | 96.7 /100 | #112 | Exceptional $41,319 |
| Macedonians | 96.4 /100 | #113 | Exceptional $41,286 |
| Immigrants | England | 96.4 /100 | #114 | Exceptional $41,277 |
| Koreans | 96.4 /100 | #115 | Exceptional $41,276 |