French Canadian vs Central American Median Female Earnings
COMPARE
French Canadian
Central American
Median Female Earnings
Median Female Earnings Comparison
French Canadians
Central Americans
$38,436
MEDIAN FEMALE EARNINGS
6.8/ 100
METRIC RATING
226th/ 347
METRIC RANK
$36,492
MEDIAN FEMALE EARNINGS
0.1/ 100
METRIC RATING
276th/ 347
METRIC RANK
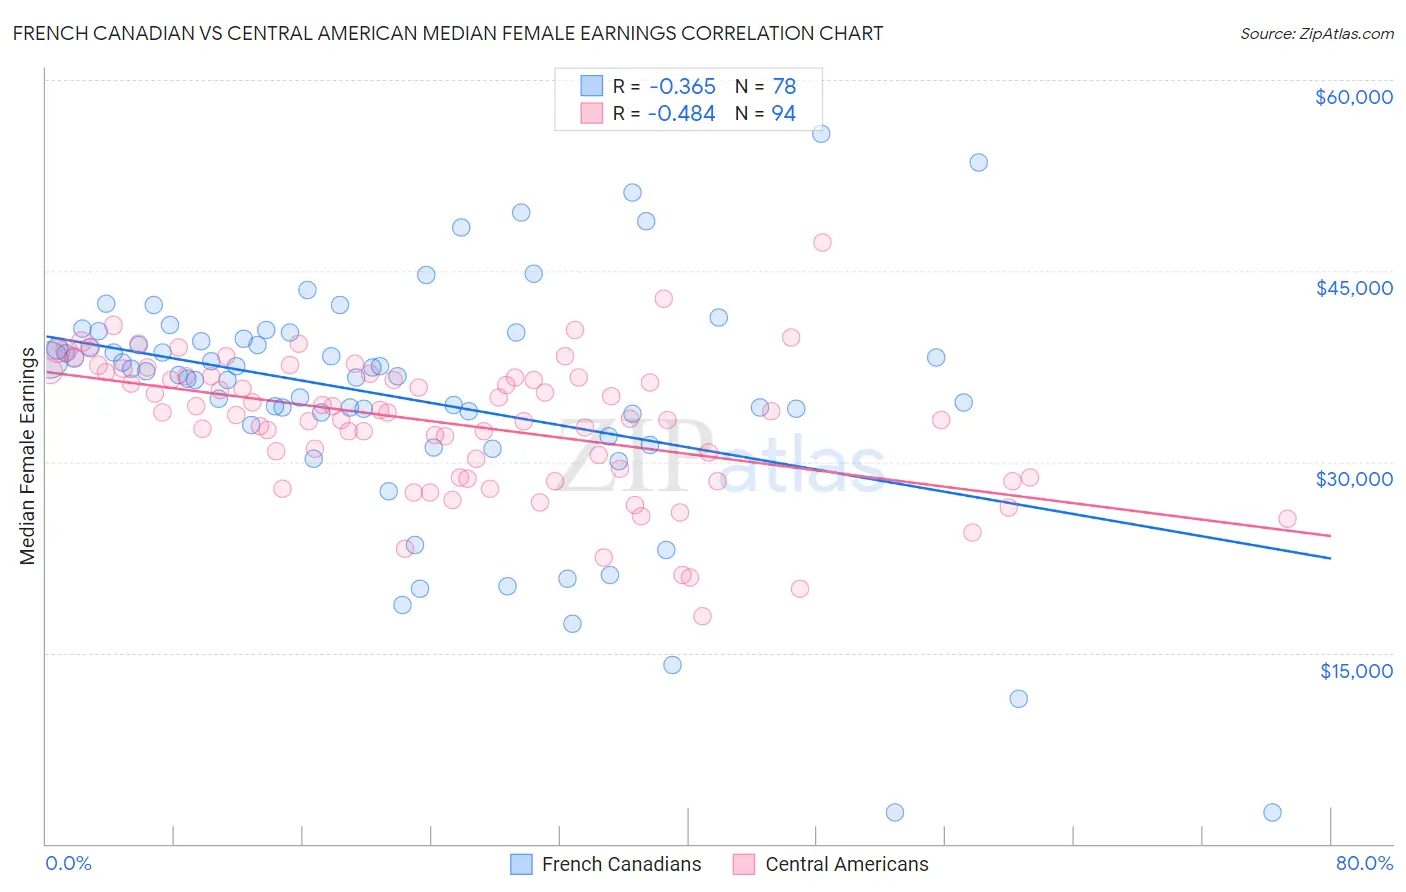
French Canadian vs Central American Median Female Earnings Correlation Chart
The statistical analysis conducted on geographies consisting of 502,023,623 people shows a mild negative correlation between the proportion of French Canadians and median female earnings in the United States with a correlation coefficient (R) of -0.365 and weighted average of $38,436. Similarly, the statistical analysis conducted on geographies consisting of 504,159,806 people shows a moderate negative correlation between the proportion of Central Americans and median female earnings in the United States with a correlation coefficient (R) of -0.484 and weighted average of $36,492, a difference of 5.3%.
Median Female Earnings Correlation Summary
| Measurement | French Canadian | Central American |
| Minimum | $2,499 | $17,895 |
| Maximum | $55,750 | $47,188 |
| Range | $53,251 | $29,293 |
| Mean | $34,934 | $33,080 |
| Median | $37,008 | $33,869 |
| Interquartile 25% (IQ1) | $32,858 | $28,801 |
| Interquartile 75% (IQ3) | $39,682 | $36,751 |
| Interquartile Range (IQR) | $6,824 | $7,950 |
| Standard Deviation (Sample) | $9,847 | $5,364 |
| Standard Deviation (Population) | $9,784 | $5,336 |
Similar Demographics by Median Female Earnings
Demographics Similar to French Canadians by Median Female Earnings
In terms of median female earnings, the demographic groups most similar to French Canadians are French ($38,457, a difference of 0.050%), Native Hawaiian ($38,461, a difference of 0.060%), Scottish ($38,397, a difference of 0.10%), Subsaharan African ($38,391, a difference of 0.12%), and Belgian ($38,382, a difference of 0.14%).
| Demographics | Rating | Rank | Median Female Earnings |
| Nepalese | 9.3 /100 | #219 | Tragic $38,603 |
| Yugoslavians | 8.8 /100 | #220 | Tragic $38,573 |
| Immigrants | Azores | 8.8 /100 | #221 | Tragic $38,573 |
| Japanese | 8.1 /100 | #222 | Tragic $38,528 |
| Immigrants | Sudan | 7.8 /100 | #223 | Tragic $38,511 |
| Native Hawaiians | 7.1 /100 | #224 | Tragic $38,461 |
| French | 7.0 /100 | #225 | Tragic $38,457 |
| French Canadians | 6.8 /100 | #226 | Tragic $38,436 |
| Scottish | 6.3 /100 | #227 | Tragic $38,397 |
| Sub-Saharan Africans | 6.2 /100 | #228 | Tragic $38,391 |
| Belgians | 6.1 /100 | #229 | Tragic $38,382 |
| Basques | 5.7 /100 | #230 | Tragic $38,352 |
| Somalis | 5.5 /100 | #231 | Tragic $38,333 |
| Scandinavians | 5.2 /100 | #232 | Tragic $38,306 |
| Tongans | 5.1 /100 | #233 | Tragic $38,288 |
Demographics Similar to Central Americans by Median Female Earnings
In terms of median female earnings, the demographic groups most similar to Central Americans are Marshallese ($36,459, a difference of 0.090%), African ($36,530, a difference of 0.10%), U.S. Virgin Islander ($36,424, a difference of 0.19%), Immigrants from Caribbean ($36,414, a difference of 0.22%), and Iroquois ($36,408, a difference of 0.23%).
| Demographics | Rating | Rank | Median Female Earnings |
| Immigrants | Venezuela | 0.4 /100 | #269 | Tragic $37,003 |
| French American Indians | 0.3 /100 | #270 | Tragic $36,920 |
| Nicaraguans | 0.3 /100 | #271 | Tragic $36,904 |
| Immigrants | Dominican Republic | 0.3 /100 | #272 | Tragic $36,857 |
| Immigrants | Laos | 0.3 /100 | #273 | Tragic $36,841 |
| Immigrants | El Salvador | 0.2 /100 | #274 | Tragic $36,673 |
| Africans | 0.1 /100 | #275 | Tragic $36,530 |
| Central Americans | 0.1 /100 | #276 | Tragic $36,492 |
| Marshallese | 0.1 /100 | #277 | Tragic $36,459 |
| U.S. Virgin Islanders | 0.1 /100 | #278 | Tragic $36,424 |
| Immigrants | Caribbean | 0.1 /100 | #279 | Tragic $36,414 |
| Iroquois | 0.1 /100 | #280 | Tragic $36,408 |
| Spanish Americans | 0.1 /100 | #281 | Tragic $36,391 |
| Haitians | 0.1 /100 | #282 | Tragic $36,374 |
| Immigrants | Haiti | 0.1 /100 | #283 | Tragic $36,203 |