French Canadian vs Immigrants from Bosnia and Herzegovina Single Father Households
COMPARE
French Canadian
Immigrants from Bosnia and Herzegovina
Single Father Households
Single Father Households Comparison
French Canadians
Immigrants from Bosnia and Herzegovina
2.4%
SINGLE FATHER HOUSEHOLDS
24.7/ 100
METRIC RATING
203rd/ 347
METRIC RANK
2.4%
SINGLE FATHER HOUSEHOLDS
40.4/ 100
METRIC RATING
186th/ 347
METRIC RANK
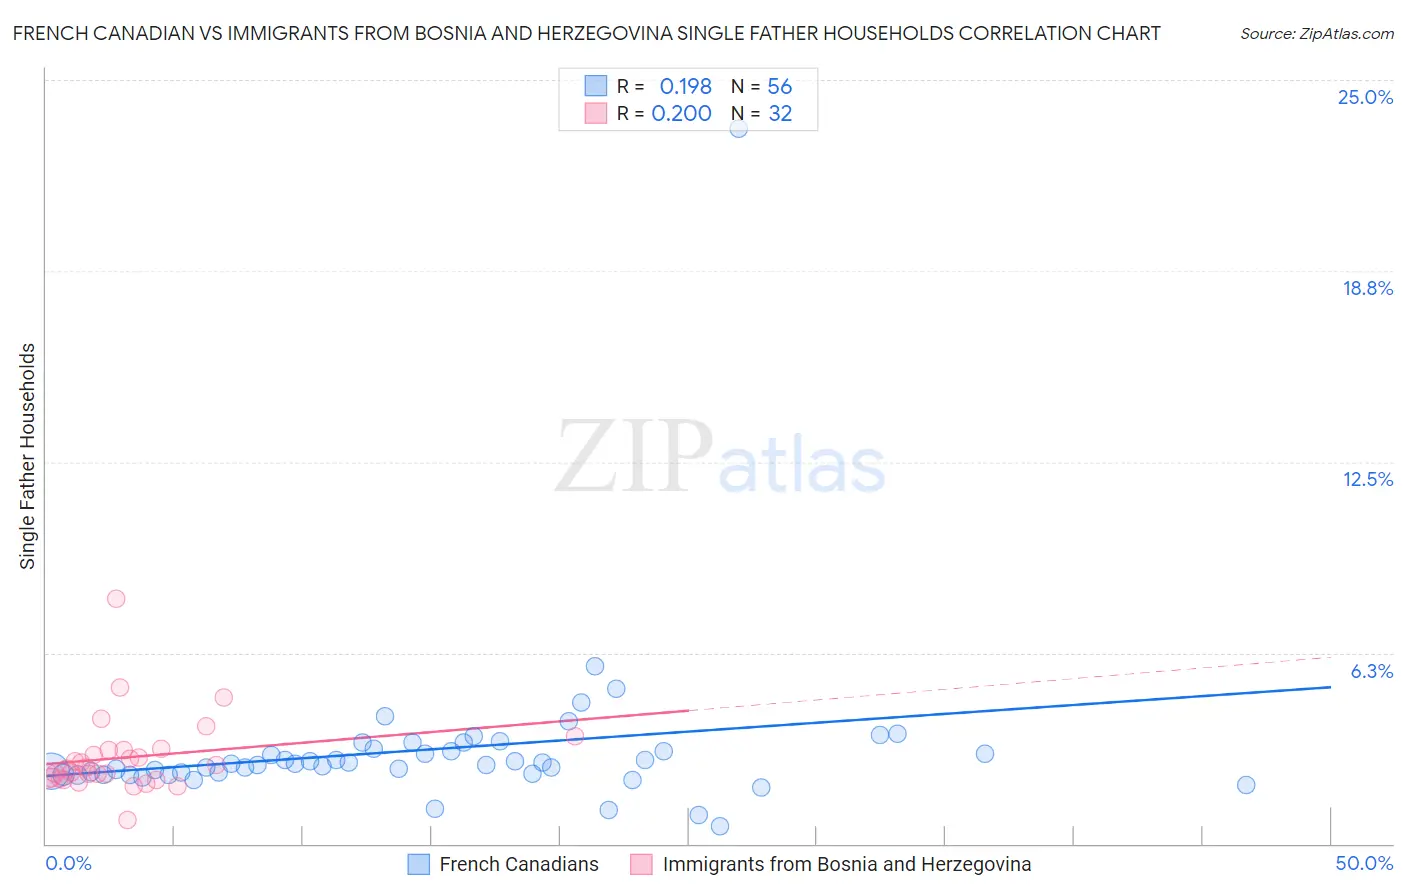
French Canadian vs Immigrants from Bosnia and Herzegovina Single Father Households Correlation Chart
The statistical analysis conducted on geographies consisting of 494,090,034 people shows a poor positive correlation between the proportion of French Canadians and percentage of single father households in the United States with a correlation coefficient (R) of 0.198 and weighted average of 2.4%. Similarly, the statistical analysis conducted on geographies consisting of 156,499,635 people shows a weak positive correlation between the proportion of Immigrants from Bosnia and Herzegovina and percentage of single father households in the United States with a correlation coefficient (R) of 0.200 and weighted average of 2.4%, a difference of 1.3%.
Single Father Households Correlation Summary
| Measurement | French Canadian | Immigrants from Bosnia and Herzegovina |
| Minimum | 0.58% | 0.77% |
| Maximum | 23.4% | 8.0% |
| Range | 22.8% | 7.3% |
| Mean | 3.1% | 2.8% |
| Median | 2.6% | 2.5% |
| Interquartile 25% (IQ1) | 2.3% | 2.1% |
| Interquartile 75% (IQ3) | 3.1% | 3.1% |
| Interquartile Range (IQR) | 0.80% | 0.90% |
| Standard Deviation (Sample) | 2.9% | 1.3% |
| Standard Deviation (Population) | 2.9% | 1.3% |
Demographics Similar to French Canadians and Immigrants from Bosnia and Herzegovina by Single Father Households
In terms of single father households, the demographic groups most similar to French Canadians are Ecuadorian (2.4%, a difference of 0.020%), German Russian (2.4%, a difference of 0.10%), Immigrants from Uganda (2.4%, a difference of 0.13%), Immigrants from Vietnam (2.4%, a difference of 0.23%), and Peruvian (2.4%, a difference of 0.23%). Similarly, the demographic groups most similar to Immigrants from Bosnia and Herzegovina are Nigerian (2.4%, a difference of 0.050%), Sri Lankan (2.4%, a difference of 0.10%), Immigrants from Colombia (2.4%, a difference of 0.51%), Hmong (2.4%, a difference of 0.58%), and U.S. Virgin Islander (2.4%, a difference of 0.69%).
| Demographics | Rating | Rank | Single Father Households |
| Sri Lankans | 41.8 /100 | #184 | Average 2.4% |
| Nigerians | 41.0 /100 | #185 | Average 2.4% |
| Immigrants | Bosnia and Herzegovina | 40.4 /100 | #186 | Average 2.4% |
| Immigrants | Colombia | 34.0 /100 | #187 | Fair 2.4% |
| Hmong | 33.0 /100 | #188 | Fair 2.4% |
| U.S. Virgin Islanders | 31.8 /100 | #189 | Fair 2.4% |
| French | 31.7 /100 | #190 | Fair 2.4% |
| Immigrants | Africa | 30.0 /100 | #191 | Fair 2.4% |
| Immigrants | Sudan | 29.8 /100 | #192 | Fair 2.4% |
| Uruguayans | 29.7 /100 | #193 | Fair 2.4% |
| Panamanians | 29.6 /100 | #194 | Fair 2.4% |
| Immigrants | Philippines | 28.7 /100 | #195 | Fair 2.4% |
| Kenyans | 28.0 /100 | #196 | Fair 2.4% |
| Germans | 28.0 /100 | #197 | Fair 2.4% |
| Scandinavians | 27.4 /100 | #198 | Fair 2.4% |
| Immigrants | Vietnam | 27.1 /100 | #199 | Fair 2.4% |
| Peruvians | 27.1 /100 | #200 | Fair 2.4% |
| Immigrants | Uganda | 26.0 /100 | #201 | Fair 2.4% |
| German Russians | 25.7 /100 | #202 | Fair 2.4% |
| French Canadians | 24.7 /100 | #203 | Fair 2.4% |
| Ecuadorians | 24.5 /100 | #204 | Fair 2.4% |