French Canadian vs Immigrants from Dominica Median Female Earnings
COMPARE
French Canadian
Immigrants from Dominica
Median Female Earnings
Median Female Earnings Comparison
French Canadians
Immigrants from Dominica
$38,436
MEDIAN FEMALE EARNINGS
6.8/ 100
METRIC RATING
226th/ 347
METRIC RANK
$37,825
MEDIAN FEMALE EARNINGS
2.0/ 100
METRIC RATING
252nd/ 347
METRIC RANK
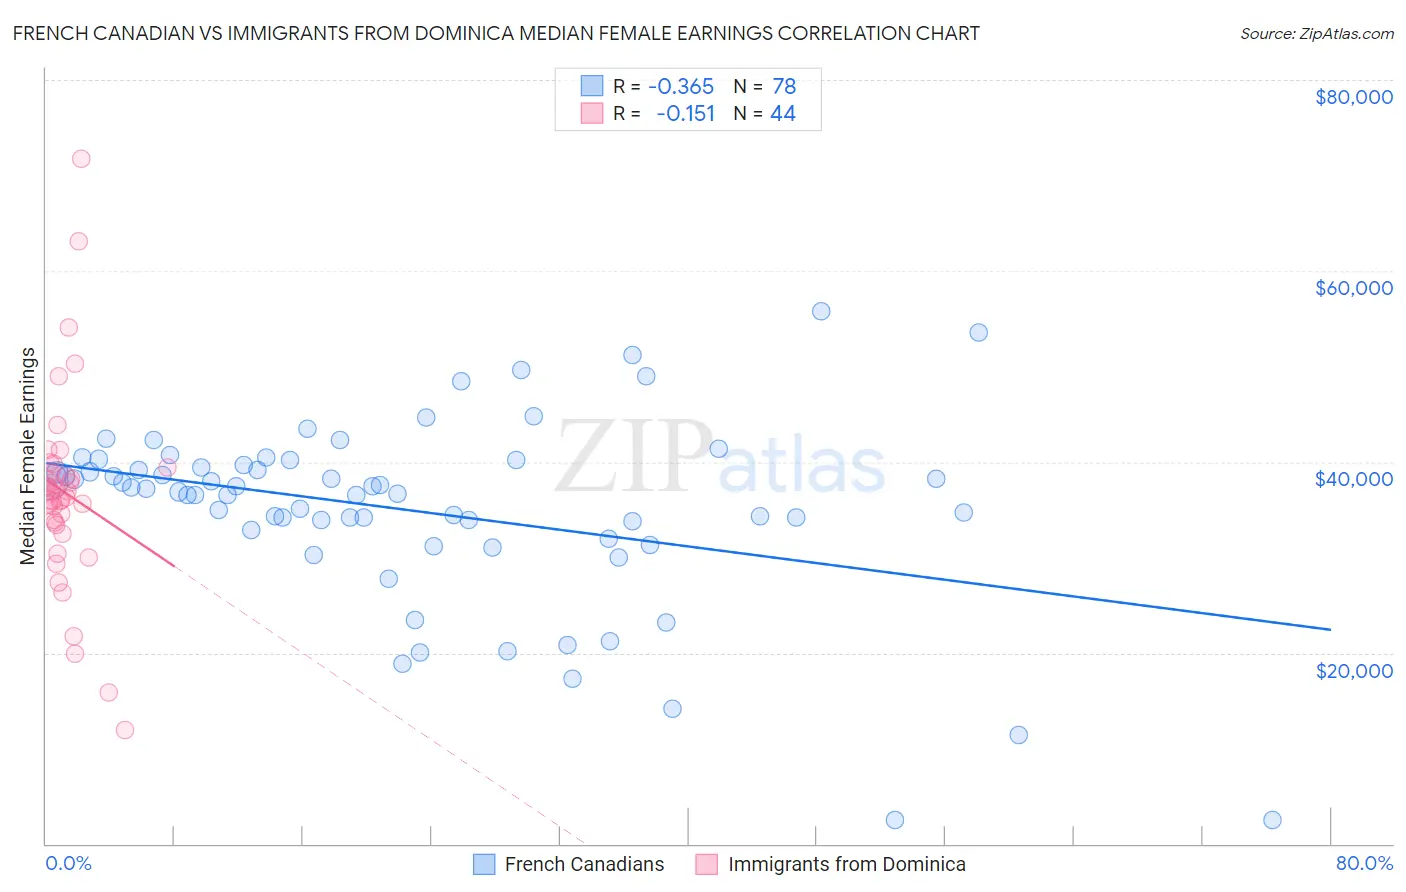
French Canadian vs Immigrants from Dominica Median Female Earnings Correlation Chart
The statistical analysis conducted on geographies consisting of 502,023,623 people shows a mild negative correlation between the proportion of French Canadians and median female earnings in the United States with a correlation coefficient (R) of -0.365 and weighted average of $38,436. Similarly, the statistical analysis conducted on geographies consisting of 83,795,110 people shows a poor negative correlation between the proportion of Immigrants from Dominica and median female earnings in the United States with a correlation coefficient (R) of -0.151 and weighted average of $37,825, a difference of 1.6%.
Median Female Earnings Correlation Summary
| Measurement | French Canadian | Immigrants from Dominica |
| Minimum | $2,499 | $11,953 |
| Maximum | $55,750 | $71,750 |
| Range | $53,251 | $59,797 |
| Mean | $34,934 | $36,730 |
| Median | $37,008 | $36,530 |
| Interquartile 25% (IQ1) | $32,858 | $33,522 |
| Interquartile 75% (IQ3) | $39,682 | $39,104 |
| Interquartile Range (IQR) | $6,824 | $5,583 |
| Standard Deviation (Sample) | $9,847 | $10,397 |
| Standard Deviation (Population) | $9,784 | $10,278 |
Similar Demographics by Median Female Earnings
Demographics Similar to French Canadians by Median Female Earnings
In terms of median female earnings, the demographic groups most similar to French Canadians are French ($38,457, a difference of 0.050%), Native Hawaiian ($38,461, a difference of 0.060%), Scottish ($38,397, a difference of 0.10%), Subsaharan African ($38,391, a difference of 0.12%), and Belgian ($38,382, a difference of 0.14%).
| Demographics | Rating | Rank | Median Female Earnings |
| Nepalese | 9.3 /100 | #219 | Tragic $38,603 |
| Yugoslavians | 8.8 /100 | #220 | Tragic $38,573 |
| Immigrants | Azores | 8.8 /100 | #221 | Tragic $38,573 |
| Japanese | 8.1 /100 | #222 | Tragic $38,528 |
| Immigrants | Sudan | 7.8 /100 | #223 | Tragic $38,511 |
| Native Hawaiians | 7.1 /100 | #224 | Tragic $38,461 |
| French | 7.0 /100 | #225 | Tragic $38,457 |
| French Canadians | 6.8 /100 | #226 | Tragic $38,436 |
| Scottish | 6.3 /100 | #227 | Tragic $38,397 |
| Sub-Saharan Africans | 6.2 /100 | #228 | Tragic $38,391 |
| Belgians | 6.1 /100 | #229 | Tragic $38,382 |
| Basques | 5.7 /100 | #230 | Tragic $38,352 |
| Somalis | 5.5 /100 | #231 | Tragic $38,333 |
| Scandinavians | 5.2 /100 | #232 | Tragic $38,306 |
| Tongans | 5.1 /100 | #233 | Tragic $38,288 |
Demographics Similar to Immigrants from Dominica by Median Female Earnings
In terms of median female earnings, the demographic groups most similar to Immigrants from Dominica are Welsh ($37,856, a difference of 0.080%), Immigrants from Iraq ($37,864, a difference of 0.10%), Alaskan Athabascan ($37,905, a difference of 0.21%), Swiss ($37,904, a difference of 0.21%), and Immigrants from Somalia ($37,914, a difference of 0.23%).
| Demographics | Rating | Rank | Median Female Earnings |
| Immigrants | Middle Africa | 2.7 /100 | #245 | Tragic $37,965 |
| Delaware | 2.6 /100 | #246 | Tragic $37,964 |
| Immigrants | Somalia | 2.4 /100 | #247 | Tragic $37,914 |
| Alaskan Athabascans | 2.3 /100 | #248 | Tragic $37,905 |
| Swiss | 2.3 /100 | #249 | Tragic $37,904 |
| Immigrants | Iraq | 2.2 /100 | #250 | Tragic $37,864 |
| Welsh | 2.1 /100 | #251 | Tragic $37,856 |
| Immigrants | Dominica | 2.0 /100 | #252 | Tragic $37,825 |
| Danes | 1.6 /100 | #253 | Tragic $37,730 |
| Whites/Caucasians | 1.1 /100 | #254 | Tragic $37,531 |
| Colville | 1.1 /100 | #255 | Tragic $37,514 |
| Samoans | 1.0 /100 | #256 | Tragic $37,498 |
| Hawaiians | 1.0 /100 | #257 | Tragic $37,497 |
| Belizeans | 0.9 /100 | #258 | Tragic $37,429 |
| Scotch-Irish | 0.8 /100 | #259 | Tragic $37,383 |