French Canadian vs Immigrants from Ireland Median Female Earnings
COMPARE
French Canadian
Immigrants from Ireland
Median Female Earnings
Median Female Earnings Comparison
French Canadians
Immigrants from Ireland
$38,436
MEDIAN FEMALE EARNINGS
6.8/ 100
METRIC RATING
226th/ 347
METRIC RANK
$47,598
MEDIAN FEMALE EARNINGS
100.0/ 100
METRIC RATING
6th/ 347
METRIC RANK
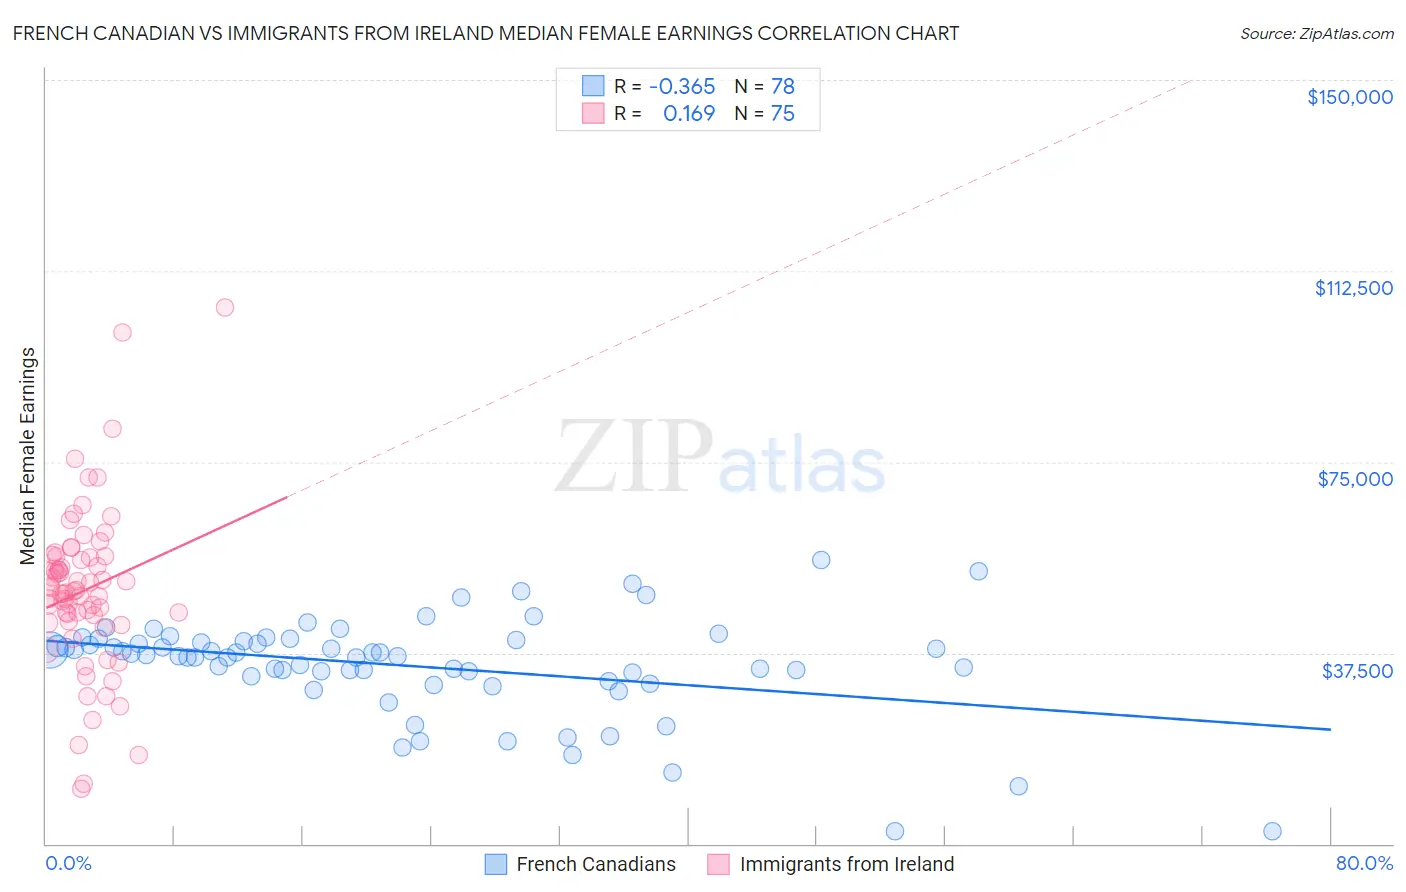
French Canadian vs Immigrants from Ireland Median Female Earnings Correlation Chart
The statistical analysis conducted on geographies consisting of 502,023,623 people shows a mild negative correlation between the proportion of French Canadians and median female earnings in the United States with a correlation coefficient (R) of -0.365 and weighted average of $38,436. Similarly, the statistical analysis conducted on geographies consisting of 240,688,654 people shows a poor positive correlation between the proportion of Immigrants from Ireland and median female earnings in the United States with a correlation coefficient (R) of 0.169 and weighted average of $47,598, a difference of 23.8%.
Median Female Earnings Correlation Summary
| Measurement | French Canadian | Immigrants from Ireland |
| Minimum | $2,499 | $10,833 |
| Maximum | $55,750 | $105,254 |
| Range | $53,251 | $94,421 |
| Mean | $34,934 | $49,745 |
| Median | $37,008 | $49,556 |
| Interquartile 25% (IQ1) | $32,858 | $43,791 |
| Interquartile 75% (IQ3) | $39,682 | $56,354 |
| Interquartile Range (IQR) | $6,824 | $12,564 |
| Standard Deviation (Sample) | $9,847 | $15,960 |
| Standard Deviation (Population) | $9,784 | $15,854 |
Similar Demographics by Median Female Earnings
Demographics Similar to French Canadians by Median Female Earnings
In terms of median female earnings, the demographic groups most similar to French Canadians are French ($38,457, a difference of 0.050%), Native Hawaiian ($38,461, a difference of 0.060%), Scottish ($38,397, a difference of 0.10%), Subsaharan African ($38,391, a difference of 0.12%), and Belgian ($38,382, a difference of 0.14%).
| Demographics | Rating | Rank | Median Female Earnings |
| Nepalese | 9.3 /100 | #219 | Tragic $38,603 |
| Yugoslavians | 8.8 /100 | #220 | Tragic $38,573 |
| Immigrants | Azores | 8.8 /100 | #221 | Tragic $38,573 |
| Japanese | 8.1 /100 | #222 | Tragic $38,528 |
| Immigrants | Sudan | 7.8 /100 | #223 | Tragic $38,511 |
| Native Hawaiians | 7.1 /100 | #224 | Tragic $38,461 |
| French | 7.0 /100 | #225 | Tragic $38,457 |
| French Canadians | 6.8 /100 | #226 | Tragic $38,436 |
| Scottish | 6.3 /100 | #227 | Tragic $38,397 |
| Sub-Saharan Africans | 6.2 /100 | #228 | Tragic $38,391 |
| Belgians | 6.1 /100 | #229 | Tragic $38,382 |
| Basques | 5.7 /100 | #230 | Tragic $38,352 |
| Somalis | 5.5 /100 | #231 | Tragic $38,333 |
| Scandinavians | 5.2 /100 | #232 | Tragic $38,306 |
| Tongans | 5.1 /100 | #233 | Tragic $38,288 |
Demographics Similar to Immigrants from Ireland by Median Female Earnings
In terms of median female earnings, the demographic groups most similar to Immigrants from Ireland are Thai ($47,577, a difference of 0.040%), Iranian ($47,421, a difference of 0.37%), Immigrants from Singapore ($47,986, a difference of 0.82%), Immigrants from Iran ($47,154, a difference of 0.94%), and Immigrants from China ($46,972, a difference of 1.3%).
| Demographics | Rating | Rank | Median Female Earnings |
| Immigrants | Hong Kong | 100.0 /100 | #1 | Exceptional $49,818 |
| Filipinos | 100.0 /100 | #2 | Exceptional $49,508 |
| Immigrants | Taiwan | 100.0 /100 | #3 | Exceptional $49,256 |
| Immigrants | India | 100.0 /100 | #4 | Exceptional $48,292 |
| Immigrants | Singapore | 100.0 /100 | #5 | Exceptional $47,986 |
| Immigrants | Ireland | 100.0 /100 | #6 | Exceptional $47,598 |
| Thais | 100.0 /100 | #7 | Exceptional $47,577 |
| Iranians | 100.0 /100 | #8 | Exceptional $47,421 |
| Immigrants | Iran | 100.0 /100 | #9 | Exceptional $47,154 |
| Immigrants | China | 100.0 /100 | #10 | Exceptional $46,972 |
| Okinawans | 100.0 /100 | #11 | Exceptional $46,905 |
| Immigrants | Israel | 100.0 /100 | #12 | Exceptional $46,902 |
| Immigrants | Australia | 100.0 /100 | #13 | Exceptional $46,573 |
| Soviet Union | 100.0 /100 | #14 | Exceptional $46,556 |
| Immigrants | Eastern Asia | 100.0 /100 | #15 | Exceptional $46,502 |