Finnish vs Guatemalan Householder Income Under 25 years
COMPARE
Finnish
Guatemalan
Householder Income Under 25 years
Householder Income Under 25 years Comparison
Finns
Guatemalans
$51,827
HOUSEHOLDER INCOME UNDER 25 YEARS
29.2/ 100
METRIC RATING
178th/ 347
METRIC RANK
$51,525
HOUSEHOLDER INCOME UNDER 25 YEARS
16.4/ 100
METRIC RATING
194th/ 347
METRIC RANK
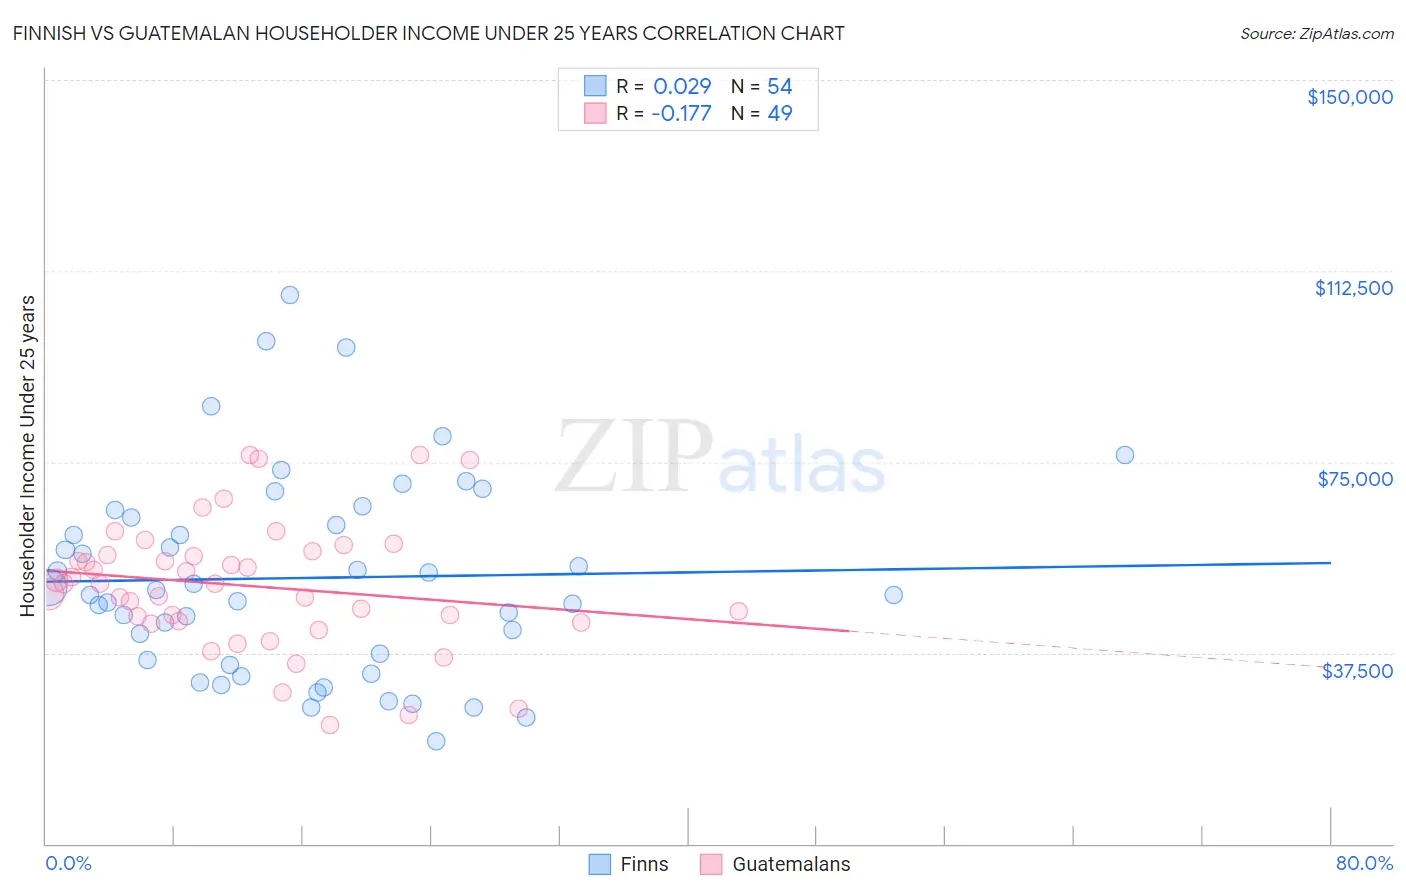
Finnish vs Guatemalan Householder Income Under 25 years Correlation Chart
The statistical analysis conducted on geographies consisting of 338,519,721 people shows no correlation between the proportion of Finns and household income with householder under the age of 25 in the United States with a correlation coefficient (R) of 0.029 and weighted average of $51,827. Similarly, the statistical analysis conducted on geographies consisting of 347,797,058 people shows a poor negative correlation between the proportion of Guatemalans and household income with householder under the age of 25 in the United States with a correlation coefficient (R) of -0.177 and weighted average of $51,525, a difference of 0.59%.
Householder Income Under 25 years Correlation Summary
| Measurement | Finnish | Guatemalan |
| Minimum | $20,019 | $23,209 |
| Maximum | $107,709 | $76,250 |
| Range | $87,690 | $53,041 |
| Mean | $52,217 | $50,650 |
| Median | $49,349 | $51,054 |
| Interquartile 25% (IQ1) | $36,122 | $43,579 |
| Interquartile 75% (IQ3) | $63,954 | $57,069 |
| Interquartile Range (IQR) | $27,832 | $13,491 |
| Standard Deviation (Sample) | $19,708 | $12,439 |
| Standard Deviation (Population) | $19,525 | $12,311 |
Demographics Similar to Finns and Guatemalans by Householder Income Under 25 years
In terms of householder income under 25 years, the demographic groups most similar to Finns are Basque ($51,818, a difference of 0.020%), Immigrants from England ($51,817, a difference of 0.020%), British West Indian ($51,844, a difference of 0.030%), European ($51,796, a difference of 0.060%), and Jordanian ($51,796, a difference of 0.060%). Similarly, the demographic groups most similar to Guatemalans are Estonian ($51,523, a difference of 0.0%), Palestinian ($51,515, a difference of 0.020%), Immigrants from Eritrea ($51,574, a difference of 0.090%), West Indian ($51,583, a difference of 0.11%), and Malaysian ($51,615, a difference of 0.17%).
| Demographics | Rating | Rank | Householder Income Under 25 years |
| Austrians | 32.9 /100 | #176 | Fair $51,898 |
| British West Indians | 30.0 /100 | #177 | Fair $51,844 |
| Finns | 29.2 /100 | #178 | Fair $51,827 |
| Basques | 28.7 /100 | #179 | Fair $51,818 |
| Immigrants | England | 28.7 /100 | #180 | Fair $51,817 |
| Europeans | 27.6 /100 | #181 | Fair $51,796 |
| Jordanians | 27.6 /100 | #182 | Fair $51,796 |
| Mexican American Indians | 27.0 /100 | #183 | Fair $51,783 |
| Paiute | 25.1 /100 | #184 | Fair $51,743 |
| Immigrants | Latvia | 24.8 /100 | #185 | Fair $51,737 |
| Alaskan Athabascans | 23.8 /100 | #186 | Fair $51,713 |
| Immigrants | South Africa | 23.4 /100 | #187 | Fair $51,705 |
| Northern Europeans | 22.2 /100 | #188 | Fair $51,678 |
| Croatians | 21.6 /100 | #189 | Fair $51,662 |
| Malaysians | 19.7 /100 | #190 | Poor $51,615 |
| Panamanians | 19.5 /100 | #191 | Poor $51,611 |
| West Indians | 18.5 /100 | #192 | Poor $51,583 |
| Immigrants | Eritrea | 18.1 /100 | #193 | Poor $51,574 |
| Guatemalans | 16.4 /100 | #194 | Poor $51,525 |
| Estonians | 16.4 /100 | #195 | Poor $51,523 |
| Palestinians | 16.1 /100 | #196 | Poor $51,515 |