Finnish vs Central American Indian Householder Income Under 25 years
COMPARE
Finnish
Central American Indian
Householder Income Under 25 years
Householder Income Under 25 years Comparison
Finns
Central American Indians
$51,827
HOUSEHOLDER INCOME UNDER 25 YEARS
29.2/ 100
METRIC RATING
178th/ 347
METRIC RANK
$48,643
HOUSEHOLDER INCOME UNDER 25 YEARS
0.0/ 100
METRIC RATING
295th/ 347
METRIC RANK
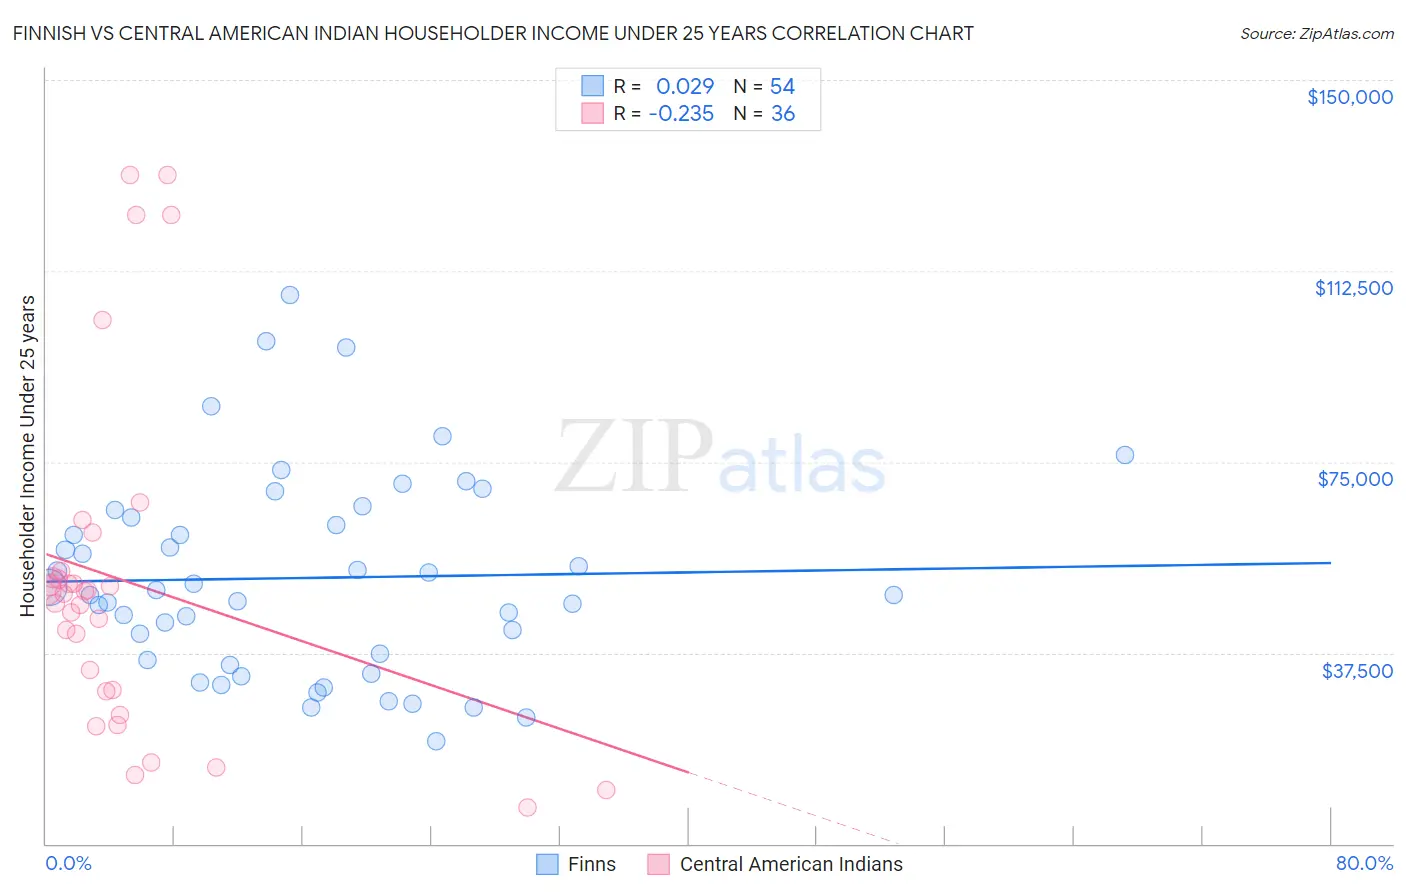
Finnish vs Central American Indian Householder Income Under 25 years Correlation Chart
The statistical analysis conducted on geographies consisting of 338,519,721 people shows no correlation between the proportion of Finns and household income with householder under the age of 25 in the United States with a correlation coefficient (R) of 0.029 and weighted average of $51,827. Similarly, the statistical analysis conducted on geographies consisting of 284,650,168 people shows a weak negative correlation between the proportion of Central American Indians and household income with householder under the age of 25 in the United States with a correlation coefficient (R) of -0.235 and weighted average of $48,643, a difference of 6.6%.
Householder Income Under 25 years Correlation Summary
| Measurement | Finnish | Central American Indian |
| Minimum | $20,019 | $7,000 |
| Maximum | $107,709 | $131,250 |
| Range | $87,690 | $124,250 |
| Mean | $52,217 | $51,609 |
| Median | $49,349 | $49,361 |
| Interquartile 25% (IQ1) | $36,122 | $29,986 |
| Interquartile 75% (IQ3) | $63,954 | $52,889 |
| Interquartile Range (IQR) | $27,832 | $22,903 |
| Standard Deviation (Sample) | $19,708 | $32,843 |
| Standard Deviation (Population) | $19,525 | $32,383 |
Similar Demographics by Householder Income Under 25 years
Demographics Similar to Finns by Householder Income Under 25 years
In terms of householder income under 25 years, the demographic groups most similar to Finns are Basque ($51,818, a difference of 0.020%), Immigrants from England ($51,817, a difference of 0.020%), British West Indian ($51,844, a difference of 0.030%), European ($51,796, a difference of 0.060%), and Jordanian ($51,796, a difference of 0.060%).
| Demographics | Rating | Rank | Householder Income Under 25 years |
| Immigrants | Uruguay | 56.8 /100 | #171 | Average $52,302 |
| Cypriots | 51.2 /100 | #172 | Average $52,209 |
| Barbadians | 50.8 /100 | #173 | Average $52,202 |
| Immigrants | Western Asia | 50.0 /100 | #174 | Average $52,190 |
| Immigrants | Zimbabwe | 33.8 /100 | #175 | Fair $51,914 |
| Austrians | 32.9 /100 | #176 | Fair $51,898 |
| British West Indians | 30.0 /100 | #177 | Fair $51,844 |
| Finns | 29.2 /100 | #178 | Fair $51,827 |
| Basques | 28.7 /100 | #179 | Fair $51,818 |
| Immigrants | England | 28.7 /100 | #180 | Fair $51,817 |
| Europeans | 27.6 /100 | #181 | Fair $51,796 |
| Jordanians | 27.6 /100 | #182 | Fair $51,796 |
| Mexican American Indians | 27.0 /100 | #183 | Fair $51,783 |
| Paiute | 25.1 /100 | #184 | Fair $51,743 |
| Immigrants | Latvia | 24.8 /100 | #185 | Fair $51,737 |
Demographics Similar to Central American Indians by Householder Income Under 25 years
In terms of householder income under 25 years, the demographic groups most similar to Central American Indians are Somali ($48,657, a difference of 0.030%), Blackfeet ($48,603, a difference of 0.080%), Subsaharan African ($48,691, a difference of 0.10%), Shoshone ($48,720, a difference of 0.16%), and Immigrants from Burma/Myanmar ($48,749, a difference of 0.22%).
| Demographics | Rating | Rank | Householder Income Under 25 years |
| Liberians | 0.0 /100 | #288 | Tragic $48,917 |
| Hondurans | 0.0 /100 | #289 | Tragic $48,885 |
| Americans | 0.0 /100 | #290 | Tragic $48,860 |
| Immigrants | Burma/Myanmar | 0.0 /100 | #291 | Tragic $48,749 |
| Shoshone | 0.0 /100 | #292 | Tragic $48,720 |
| Sub-Saharan Africans | 0.0 /100 | #293 | Tragic $48,691 |
| Somalis | 0.0 /100 | #294 | Tragic $48,657 |
| Central American Indians | 0.0 /100 | #295 | Tragic $48,643 |
| Blackfeet | 0.0 /100 | #296 | Tragic $48,603 |
| Cree | 0.0 /100 | #297 | Tragic $48,514 |
| Yaqui | 0.0 /100 | #298 | Tragic $48,300 |
| Immigrants | Honduras | 0.0 /100 | #299 | Tragic $48,267 |
| Immigrants | Somalia | 0.0 /100 | #300 | Tragic $48,135 |
| Immigrants | Kuwait | 0.0 /100 | #301 | Tragic $48,126 |
| Immigrants | Liberia | 0.0 /100 | #302 | Tragic $47,981 |