Finnish vs Immigrants from Netherlands Householder Income Under 25 years
COMPARE
Finnish
Immigrants from Netherlands
Householder Income Under 25 years
Householder Income Under 25 years Comparison
Finns
Immigrants from Netherlands
$51,827
HOUSEHOLDER INCOME UNDER 25 YEARS
29.2/ 100
METRIC RATING
178th/ 347
METRIC RANK
$52,592
HOUSEHOLDER INCOME UNDER 25 YEARS
72.8/ 100
METRIC RATING
158th/ 347
METRIC RANK
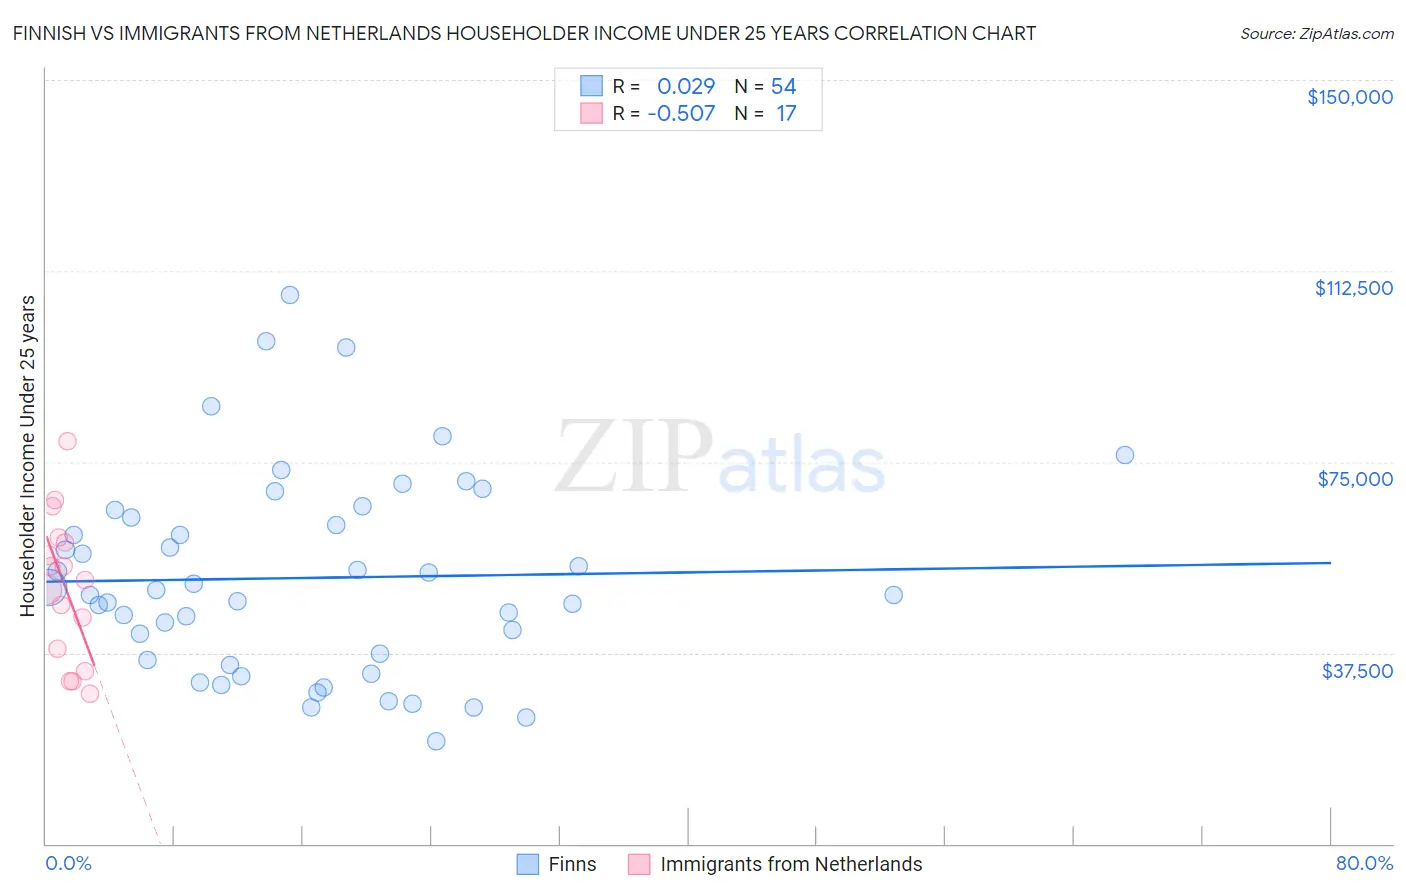
Finnish vs Immigrants from Netherlands Householder Income Under 25 years Correlation Chart
The statistical analysis conducted on geographies consisting of 338,519,721 people shows no correlation between the proportion of Finns and household income with householder under the age of 25 in the United States with a correlation coefficient (R) of 0.029 and weighted average of $51,827. Similarly, the statistical analysis conducted on geographies consisting of 207,489,365 people shows a substantial negative correlation between the proportion of Immigrants from Netherlands and household income with householder under the age of 25 in the United States with a correlation coefficient (R) of -0.507 and weighted average of $52,592, a difference of 1.5%.
Householder Income Under 25 years Correlation Summary
| Measurement | Finnish | Immigrants from Netherlands |
| Minimum | $20,019 | $29,438 |
| Maximum | $107,709 | $79,004 |
| Range | $87,690 | $49,567 |
| Mean | $52,217 | $50,356 |
| Median | $49,349 | $51,917 |
| Interquartile 25% (IQ1) | $36,122 | $36,019 |
| Interquartile 75% (IQ3) | $63,954 | $59,656 |
| Interquartile Range (IQR) | $27,832 | $23,637 |
| Standard Deviation (Sample) | $19,708 | $14,151 |
| Standard Deviation (Population) | $19,525 | $13,728 |
Demographics Similar to Finns and Immigrants from Netherlands by Householder Income Under 25 years
In terms of householder income under 25 years, the demographic groups most similar to Finns are British West Indian ($51,844, a difference of 0.030%), Austrian ($51,898, a difference of 0.14%), Immigrants from Zimbabwe ($51,914, a difference of 0.17%), Immigrants from Western Asia ($52,190, a difference of 0.70%), and Barbadian ($52,202, a difference of 0.72%). Similarly, the demographic groups most similar to Immigrants from Netherlands are Mongolian ($52,540, a difference of 0.10%), Immigrants from Turkey ($52,503, a difference of 0.17%), Uruguayan ($52,465, a difference of 0.24%), Immigrants from Cambodia ($52,450, a difference of 0.27%), and Immigrants from Chile ($52,440, a difference of 0.29%).
| Demographics | Rating | Rank | Householder Income Under 25 years |
| Immigrants | Netherlands | 72.8 /100 | #158 | Good $52,592 |
| Mongolians | 70.2 /100 | #159 | Good $52,540 |
| Immigrants | Turkey | 68.3 /100 | #160 | Good $52,503 |
| Uruguayans | 66.2 /100 | #161 | Good $52,465 |
| Immigrants | Cambodia | 65.4 /100 | #162 | Good $52,450 |
| Immigrants | Chile | 64.8 /100 | #163 | Good $52,440 |
| Immigrants | Trinidad and Tobago | 64.7 /100 | #164 | Good $52,437 |
| Poles | 63.0 /100 | #165 | Good $52,407 |
| Immigrants | Austria | 62.6 /100 | #166 | Good $52,400 |
| Immigrants | Uganda | 61.1 /100 | #167 | Good $52,374 |
| Japanese | 60.5 /100 | #168 | Good $52,365 |
| Canadians | 58.8 /100 | #169 | Average $52,336 |
| Israelis | 58.8 /100 | #170 | Average $52,335 |
| Immigrants | Uruguay | 56.8 /100 | #171 | Average $52,302 |
| Cypriots | 51.2 /100 | #172 | Average $52,209 |
| Barbadians | 50.8 /100 | #173 | Average $52,202 |
| Immigrants | Western Asia | 50.0 /100 | #174 | Average $52,190 |
| Immigrants | Zimbabwe | 33.8 /100 | #175 | Fair $51,914 |
| Austrians | 32.9 /100 | #176 | Fair $51,898 |
| British West Indians | 30.0 /100 | #177 | Fair $51,844 |
| Finns | 29.2 /100 | #178 | Fair $51,827 |