Finnish vs Laotian Householder Income Under 25 years
COMPARE
Finnish
Laotian
Householder Income Under 25 years
Householder Income Under 25 years Comparison
Finns
Laotians
$51,827
HOUSEHOLDER INCOME UNDER 25 YEARS
29.2/ 100
METRIC RATING
178th/ 347
METRIC RANK
$54,369
HOUSEHOLDER INCOME UNDER 25 YEARS
99.5/ 100
METRIC RATING
83rd/ 347
METRIC RANK
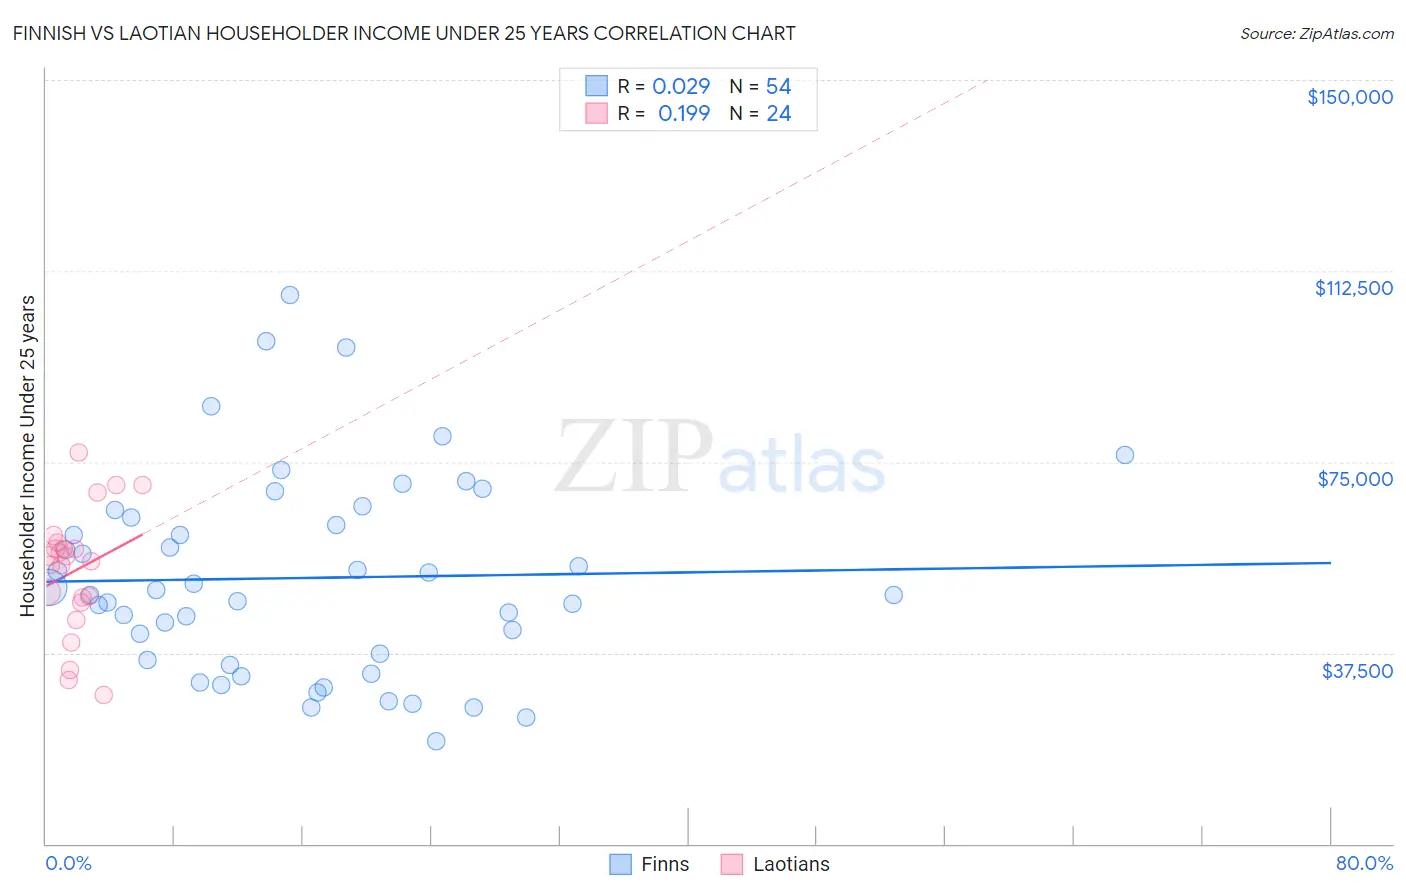
Finnish vs Laotian Householder Income Under 25 years Correlation Chart
The statistical analysis conducted on geographies consisting of 338,519,721 people shows no correlation between the proportion of Finns and household income with householder under the age of 25 in the United States with a correlation coefficient (R) of 0.029 and weighted average of $51,827. Similarly, the statistical analysis conducted on geographies consisting of 201,813,487 people shows a poor positive correlation between the proportion of Laotians and household income with householder under the age of 25 in the United States with a correlation coefficient (R) of 0.199 and weighted average of $54,369, a difference of 4.9%.
Householder Income Under 25 years Correlation Summary
| Measurement | Finnish | Laotian |
| Minimum | $20,019 | $29,129 |
| Maximum | $107,709 | $76,932 |
| Range | $87,690 | $47,803 |
| Mean | $52,217 | $53,668 |
| Median | $49,349 | $55,928 |
| Interquartile 25% (IQ1) | $36,122 | $47,909 |
| Interquartile 75% (IQ3) | $63,954 | $58,617 |
| Interquartile Range (IQR) | $27,832 | $10,708 |
| Standard Deviation (Sample) | $19,708 | $12,091 |
| Standard Deviation (Population) | $19,525 | $11,836 |
Similar Demographics by Householder Income Under 25 years
Demographics Similar to Finns by Householder Income Under 25 years
In terms of householder income under 25 years, the demographic groups most similar to Finns are Basque ($51,818, a difference of 0.020%), Immigrants from England ($51,817, a difference of 0.020%), British West Indian ($51,844, a difference of 0.030%), European ($51,796, a difference of 0.060%), and Jordanian ($51,796, a difference of 0.060%).
| Demographics | Rating | Rank | Householder Income Under 25 years |
| Immigrants | Uruguay | 56.8 /100 | #171 | Average $52,302 |
| Cypriots | 51.2 /100 | #172 | Average $52,209 |
| Barbadians | 50.8 /100 | #173 | Average $52,202 |
| Immigrants | Western Asia | 50.0 /100 | #174 | Average $52,190 |
| Immigrants | Zimbabwe | 33.8 /100 | #175 | Fair $51,914 |
| Austrians | 32.9 /100 | #176 | Fair $51,898 |
| British West Indians | 30.0 /100 | #177 | Fair $51,844 |
| Finns | 29.2 /100 | #178 | Fair $51,827 |
| Basques | 28.7 /100 | #179 | Fair $51,818 |
| Immigrants | England | 28.7 /100 | #180 | Fair $51,817 |
| Europeans | 27.6 /100 | #181 | Fair $51,796 |
| Jordanians | 27.6 /100 | #182 | Fair $51,796 |
| Mexican American Indians | 27.0 /100 | #183 | Fair $51,783 |
| Paiute | 25.1 /100 | #184 | Fair $51,743 |
| Immigrants | Latvia | 24.8 /100 | #185 | Fair $51,737 |
Demographics Similar to Laotians by Householder Income Under 25 years
In terms of householder income under 25 years, the demographic groups most similar to Laotians are Bulgarian ($54,352, a difference of 0.030%), Immigrants from Czechoslovakia ($54,352, a difference of 0.030%), Russian ($54,389, a difference of 0.040%), Immigrants from Croatia ($54,343, a difference of 0.050%), and Brazilian ($54,335, a difference of 0.060%).
| Demographics | Rating | Rank | Householder Income Under 25 years |
| Immigrants | Brazil | 99.6 /100 | #76 | Exceptional $54,487 |
| Immigrants | Southern Europe | 99.6 /100 | #77 | Exceptional $54,484 |
| Nepalese | 99.6 /100 | #78 | Exceptional $54,472 |
| Immigrants | Italy | 99.6 /100 | #79 | Exceptional $54,449 |
| Egyptians | 99.6 /100 | #80 | Exceptional $54,444 |
| Portuguese | 99.6 /100 | #81 | Exceptional $54,436 |
| Russians | 99.5 /100 | #82 | Exceptional $54,389 |
| Laotians | 99.5 /100 | #83 | Exceptional $54,369 |
| Bulgarians | 99.5 /100 | #84 | Exceptional $54,352 |
| Immigrants | Czechoslovakia | 99.5 /100 | #85 | Exceptional $54,352 |
| Immigrants | Croatia | 99.5 /100 | #86 | Exceptional $54,343 |
| Brazilians | 99.5 /100 | #87 | Exceptional $54,335 |
| Yakama | 99.5 /100 | #88 | Exceptional $54,321 |
| Immigrants | South America | 99.4 /100 | #89 | Exceptional $54,268 |
| Turks | 99.4 /100 | #90 | Exceptional $54,266 |