Finnish vs Northern European Unemployment Among Women with Children Under 6 years
COMPARE
Finnish
Northern European
Unemployment Among Women with Children Under 6 years
Unemployment Among Women with Children Under 6 years Comparison
Finns
Northern Europeans
8.0%
UNEMPLOYMENT AMONG WOMEN WITH CHILDREN UNDER 6 YEARS
5.3/ 100
METRIC RATING
230th/ 347
METRIC RANK
7.5%
UNEMPLOYMENT AMONG WOMEN WITH CHILDREN UNDER 6 YEARS
74.3/ 100
METRIC RATING
154th/ 347
METRIC RANK
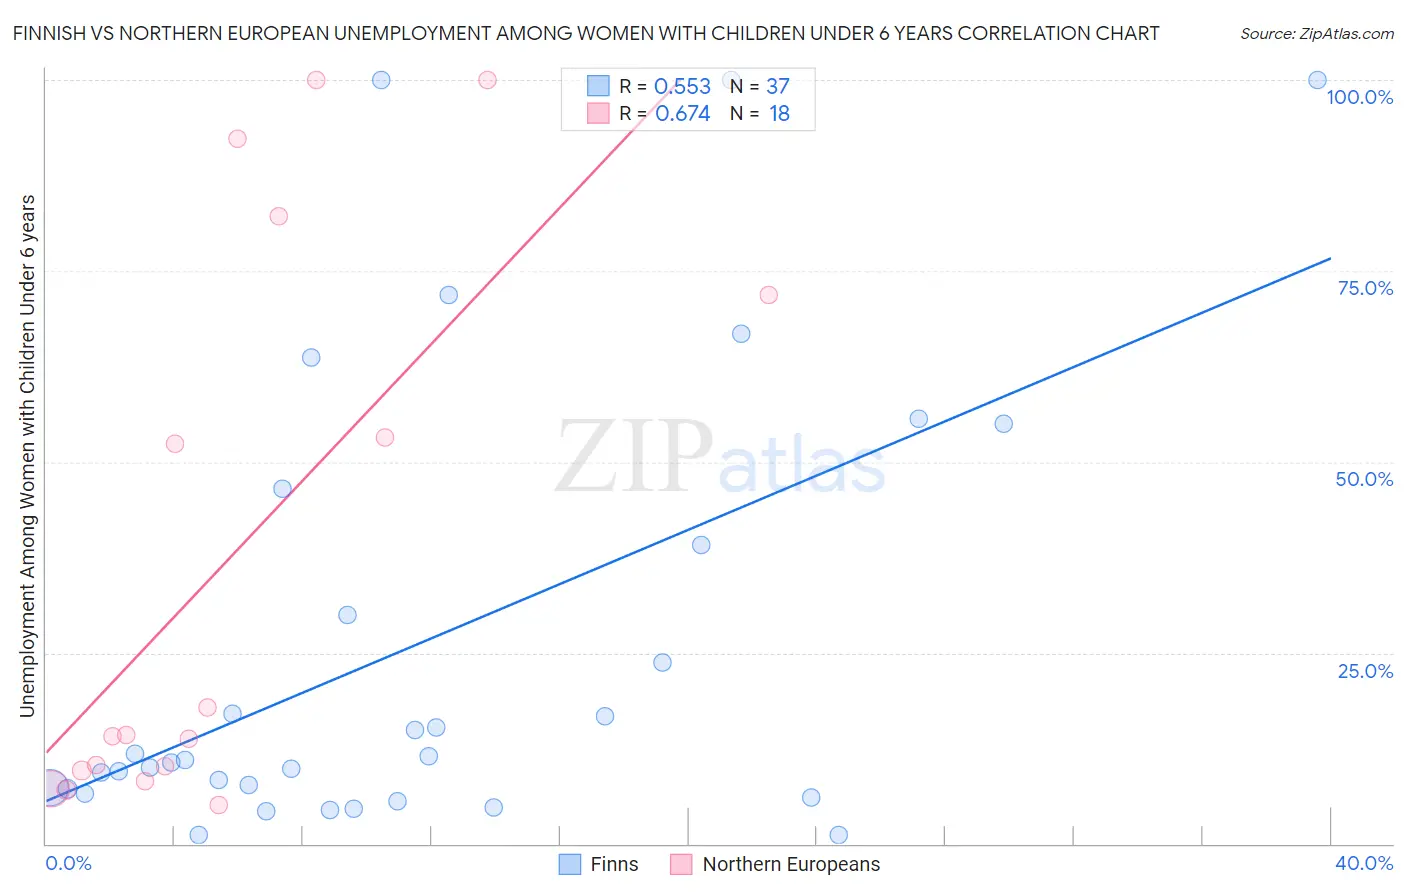
Finnish vs Northern European Unemployment Among Women with Children Under 6 years Correlation Chart
The statistical analysis conducted on geographies consisting of 294,495,197 people shows a substantial positive correlation between the proportion of Finns and unemployment rate among women with children under the age of 6 in the United States with a correlation coefficient (R) of 0.553 and weighted average of 8.0%. Similarly, the statistical analysis conducted on geographies consisting of 297,166,845 people shows a significant positive correlation between the proportion of Northern Europeans and unemployment rate among women with children under the age of 6 in the United States with a correlation coefficient (R) of 0.674 and weighted average of 7.5%, a difference of 6.7%.
Unemployment Among Women with Children Under 6 years Correlation Summary
| Measurement | Finnish | Northern European |
| Minimum | 1.1% | 5.1% |
| Maximum | 100.0% | 100.0% |
| Range | 98.9% | 94.9% |
| Mean | 26.2% | 37.2% |
| Median | 11.0% | 14.2% |
| Interquartile 25% (IQ1) | 6.9% | 9.6% |
| Interquartile 75% (IQ3) | 42.8% | 71.9% |
| Interquartile Range (IQR) | 35.9% | 62.3% |
| Standard Deviation (Sample) | 29.8% | 36.4% |
| Standard Deviation (Population) | 29.4% | 35.4% |
Similar Demographics by Unemployment Among Women with Children Under 6 years
Demographics Similar to Finns by Unemployment Among Women with Children Under 6 years
In terms of unemployment among women with children under 6 years, the demographic groups most similar to Finns are Trinidadian and Tobagonian (8.0%, a difference of 0.0%), Salvadoran (8.0%, a difference of 0.070%), Welsh (8.0%, a difference of 0.090%), Immigrants from Trinidad and Tobago (8.0%, a difference of 0.18%), and Immigrants from Sudan (8.0%, a difference of 0.22%).
| Demographics | Rating | Rank | Unemployment Among Women with Children Under 6 years |
| Carpatho Rusyns | 7.8 /100 | #223 | Tragic 8.0% |
| English | 7.2 /100 | #224 | Tragic 8.0% |
| Germans | 7.0 /100 | #225 | Tragic 8.0% |
| Senegalese | 6.2 /100 | #226 | Tragic 8.0% |
| Portuguese | 6.2 /100 | #227 | Tragic 8.0% |
| Immigrants | Sudan | 6.0 /100 | #228 | Tragic 8.0% |
| Salvadorans | 5.5 /100 | #229 | Tragic 8.0% |
| Finns | 5.3 /100 | #230 | Tragic 8.0% |
| Trinidadians and Tobagonians | 5.3 /100 | #231 | Tragic 8.0% |
| Welsh | 5.0 /100 | #232 | Tragic 8.0% |
| Immigrants | Trinidad and Tobago | 4.8 /100 | #233 | Tragic 8.0% |
| Kiowa | 4.4 /100 | #234 | Tragic 8.0% |
| Comanche | 4.3 /100 | #235 | Tragic 8.0% |
| Immigrants | Barbados | 4.2 /100 | #236 | Tragic 8.0% |
| Immigrants | Costa Rica | 4.1 /100 | #237 | Tragic 8.0% |
Demographics Similar to Northern Europeans by Unemployment Among Women with Children Under 6 years
In terms of unemployment among women with children under 6 years, the demographic groups most similar to Northern Europeans are South American (7.5%, a difference of 0.020%), Uruguayan (7.5%, a difference of 0.030%), Bangladeshi (7.5%, a difference of 0.040%), Immigrants from Peru (7.5%, a difference of 0.050%), and Immigrants from Southern Europe (7.5%, a difference of 0.10%).
| Demographics | Rating | Rank | Unemployment Among Women with Children Under 6 years |
| Immigrants | Oceania | 78.4 /100 | #147 | Good 7.5% |
| Immigrants | Brazil | 77.3 /100 | #148 | Good 7.5% |
| Colombians | 76.1 /100 | #149 | Good 7.5% |
| Aleuts | 76.0 /100 | #150 | Good 7.5% |
| Immigrants | Peru | 74.9 /100 | #151 | Good 7.5% |
| Bangladeshis | 74.8 /100 | #152 | Good 7.5% |
| Uruguayans | 74.7 /100 | #153 | Good 7.5% |
| Northern Europeans | 74.3 /100 | #154 | Good 7.5% |
| South Americans | 74.1 /100 | #155 | Good 7.5% |
| Immigrants | Southern Europe | 73.2 /100 | #156 | Good 7.5% |
| Peruvians | 72.3 /100 | #157 | Good 7.5% |
| Croatians | 71.9 /100 | #158 | Good 7.5% |
| Immigrants | Philippines | 71.3 /100 | #159 | Good 7.5% |
| Bolivians | 70.8 /100 | #160 | Good 7.5% |
| Immigrants | Western Asia | 70.2 /100 | #161 | Good 7.5% |