Finnish vs Immigrants from Portugal Householder Income Under 25 years

COMPARE

Finnish
Race
Ancestry
AfghanAfricanAlaska NativeAlaskan AthabascanAlbanianAleutAlsatianAmericanApacheArabArapahoArgentineanArmenianAssyrian/Chaldean/SyriacAustralianAustrianBahamianBangladeshiBarbadianBasqueBelgianBelizeanBermudanBhutaneseBlackfeetBolivianBrazilianBritishBritish West IndianBulgarianBurmeseCajunCambodianCanadianCape VerdeanCarpatho RusynCelticCentral AmericanCentral American IndianCherokeeCheyenneChickasawChileanChineseChippewaChoctawColombianColvilleComancheCosta RicanCreeCreekCroatianCrowCubanCypriotCzechCzechoslovakianDanishDelawareDominicanDutchDutch West IndianEastern EuropeanEcuadorianEgyptianEnglishEstonianEthiopianEuropeanFijianFilipinoFinnishFrenchFrench American IndianFrench CanadianGermanGerman RussianGhanaianGreekGuamanian/ChamorroGuatemalanGuyaneseHaitianHmongHonduranHopiHoumaHungarianIcelanderIndian (Asian)IndonesianInupiatIranianIraqiIrishIroquoisIsraeliItalianJamaicanJapaneseJordanianKenyanKiowaKoreanLaotianLatvianLebaneseLiberianLithuanianLumbeeLuxembourgerMacedonianMalaysianMalteseMarshalleseMenomineeMexicanMexican American IndianMongolianMoroccanNative HawaiianNavajoNepaleseNew ZealanderNicaraguanNigerianNorthern EuropeanNorwegianOkinawanOsageOttawaPaiutePakistaniPalestinianPanamanianParaguayanPennsylvania GermanPeruvianPimaPolishPortuguesePotawatomiPuebloPuerto RicanPuget Sound SalishRomanianRussianSalvadoranSamoanScandinavianScotch-IrishScottishSeminoleSenegaleseSerbianShoshoneSierra LeoneanSiouxSlavicSlovakSloveneSomaliSouth AfricanSouth AmericanSouth American IndianSoviet UnionSpaniardSpanishSpanish AmericanSpanish American IndianSri LankanSubsaharan AfricanSudaneseSwedishSwissSyrianTaiwaneseThaiTlingit-HaidaTohono O'OdhamTonganTrinidadian and TobagonianTsimshianTurkishU.S. Virgin IslanderUgandanUkrainianUruguayanUteVenezuelanVietnameseWelshWest IndianYakamaYaquiYugoslavianYumanYup'ikZimbabwean
Immigration
NonimmigrantsImmigrantsAfghanistanAfricaAlbaniaArgentinaArmeniaAsiaAustraliaAustriaBahamasBangladeshBarbadosBelarusBelgiumBelizeBoliviaBosnia and HerzegovinaBrazilBulgariaBurma/MyanmarCabo VerdeCambodiaCameroonCanadaCaribbeanCentral AmericaChileChinaColombiaCongoCosta RicaCroatiaCubaCzechoslovakiaDenmarkDominicaDominican RepublicEastern AfricaEastern AsiaEastern EuropeEcuadorEgyptEl SalvadorEnglandEritreaEthiopiaEuropeFijiFranceGermanyGhanaGreeceGrenadaGuatemalaGuyanaHaitiHondurasHong KongHungaryIndiaIndonesiaIranIraqIrelandIsraelItalyJamaicaJapanJordanKazakhstanKenyaKoreaKuwaitLaosLatin AmericaLatviaLebanonLiberiaLithuaniaMalaysiaMexicoMicronesiaMiddle AfricaMoldovaMoroccoNepalNetherlandsNicaraguaNigeriaNorth AmericaNorth MacedoniaNorthern AfricaNorthern EuropeNorwayOceaniaPakistanPanamaPeruPhilippinesPolandRomaniaRussiaSaudi ArabiaScotlandSenegalSerbiaSierra LeoneSingaporeSomaliaSouth AfricaSouth AmericaSouth Central AsiaSouth Eastern AsiaSouthern EuropeSpainSri LankaSt. Vincent and the GrenadinesSudanSwedenSwitzerlandSyriaTaiwanThailandTrinidad and TobagoTurkeyUgandaUkraineUruguayUzbekistanVenezuelaVietnamWest IndiesWestern AfricaWestern AsiaWestern EuropeYemenZaireZimbabweAzores
Immigrants from Portugal
Race
Ancestry
AfghanAfricanAlaska NativeAlaskan AthabascanAlbanianAleutAlsatianAmericanApacheArabArapahoArgentineanArmenianAssyrian/Chaldean/SyriacAustralianAustrianBahamianBangladeshiBarbadianBasqueBelgianBelizeanBermudanBhutaneseBlackfeetBolivianBrazilianBritishBritish West IndianBulgarianBurmeseCajunCambodianCanadianCape VerdeanCarpatho RusynCelticCentral AmericanCentral American IndianCherokeeCheyenneChickasawChileanChineseChippewaChoctawColombianColvilleComancheCosta RicanCreeCreekCroatianCrowCubanCypriotCzechCzechoslovakianDanishDelawareDominicanDutchDutch West IndianEastern EuropeanEcuadorianEgyptianEnglishEstonianEthiopianEuropeanFijianFilipinoFrenchFrench American IndianFrench CanadianGermanGerman RussianGhanaianGreekGuamanian/ChamorroGuatemalanGuyaneseHaitianHmongHonduranHopiHoumaHungarianIcelanderIndian (Asian)IndonesianInupiatIranianIraqiIrishIroquoisIsraeliItalianJamaicanJapaneseJordanianKenyanKiowaKoreanLaotianLatvianLebaneseLiberianLithuanianLumbeeLuxembourgerMacedonianMalaysianMalteseMarshalleseMenomineeMexicanMexican American IndianMongolianMoroccanNative HawaiianNavajoNepaleseNew ZealanderNicaraguanNigerianNorthern EuropeanNorwegianOkinawanOsageOttawaPaiutePakistaniPalestinianPanamanianParaguayanPennsylvania GermanPeruvianPimaPolishPortuguesePotawatomiPuebloPuerto RicanPuget Sound SalishRomanianRussianSalvadoranSamoanScandinavianScotch-IrishScottishSeminoleSenegaleseSerbianShoshoneSierra LeoneanSiouxSlavicSlovakSloveneSomaliSouth AfricanSouth AmericanSouth American IndianSoviet UnionSpaniardSpanishSpanish AmericanSpanish American IndianSri LankanSubsaharan AfricanSudaneseSwedishSwissSyrianTaiwaneseThaiTlingit-HaidaTohono O'OdhamTonganTrinidadian and TobagonianTsimshianTurkishU.S. Virgin IslanderUgandanUkrainianUruguayanUteVenezuelanVietnameseWelshWest IndianYakamaYaquiYugoslavianYumanYup'ikZimbabwean
Immigration
NonimmigrantsImmigrantsAfghanistanAfricaAlbaniaArgentinaArmeniaAsiaAustraliaAustriaBahamasBangladeshBarbadosBelarusBelgiumBelizeBoliviaBosnia and HerzegovinaBrazilBulgariaBurma/MyanmarCabo VerdeCambodiaCameroonCanadaCaribbeanCentral AmericaChileChinaColombiaCongoCosta RicaCroatiaCubaCzechoslovakiaDenmarkDominicaDominican RepublicEastern AfricaEastern AsiaEastern EuropeEcuadorEgyptEl SalvadorEnglandEritreaEthiopiaEuropeFijiFranceGermanyGhanaGreeceGrenadaGuatemalaGuyanaHaitiHondurasHong KongHungaryIndiaIndonesiaIranIraqIrelandIsraelItalyJamaicaJapanJordanKazakhstanKenyaKoreaKuwaitLaosLatin AmericaLatviaLebanonLiberiaLithuaniaMalaysiaMexicoMicronesiaMiddle AfricaMoldovaMoroccoNepalNetherlandsNicaraguaNigeriaNorth AmericaNorth MacedoniaNorthern AfricaNorthern EuropeNorwayOceaniaPakistanPanamaPeruPhilippinesPolandPortugalRomaniaRussiaSaudi ArabiaScotlandSenegalSerbiaSierra LeoneSingaporeSomaliaSouth AfricaSouth AmericaSouth Central AsiaSouth Eastern AsiaSouthern EuropeSpainSri LankaSt. Vincent and the GrenadinesSudanSwedenSwitzerlandSyriaTaiwanThailandTrinidad and TobagoTurkeyUgandaUkraineUruguayUzbekistanVenezuelaVietnamWest IndiesWestern AfricaWestern AsiaWestern EuropeYemenZaireZimbabweAzores
Householder Income Under 25 years
Income
Poverty
Unemployment
Labor Participation
Family Structure
Vehicle Availability
Education Level
Disability

Householder Income Under 25 years Comparison

Finns

Immigrants from Portugal

Fair
Exceptional
$51,827
HOUSEHOLDER INCOME UNDER 25 YEARS
29.2/ 100
METRIC RATING
178th/ 347
METRIC RANK
$54,105
HOUSEHOLDER INCOME UNDER 25 YEARS
99.1/ 100
METRIC RATING
97th/ 347
METRIC RANK

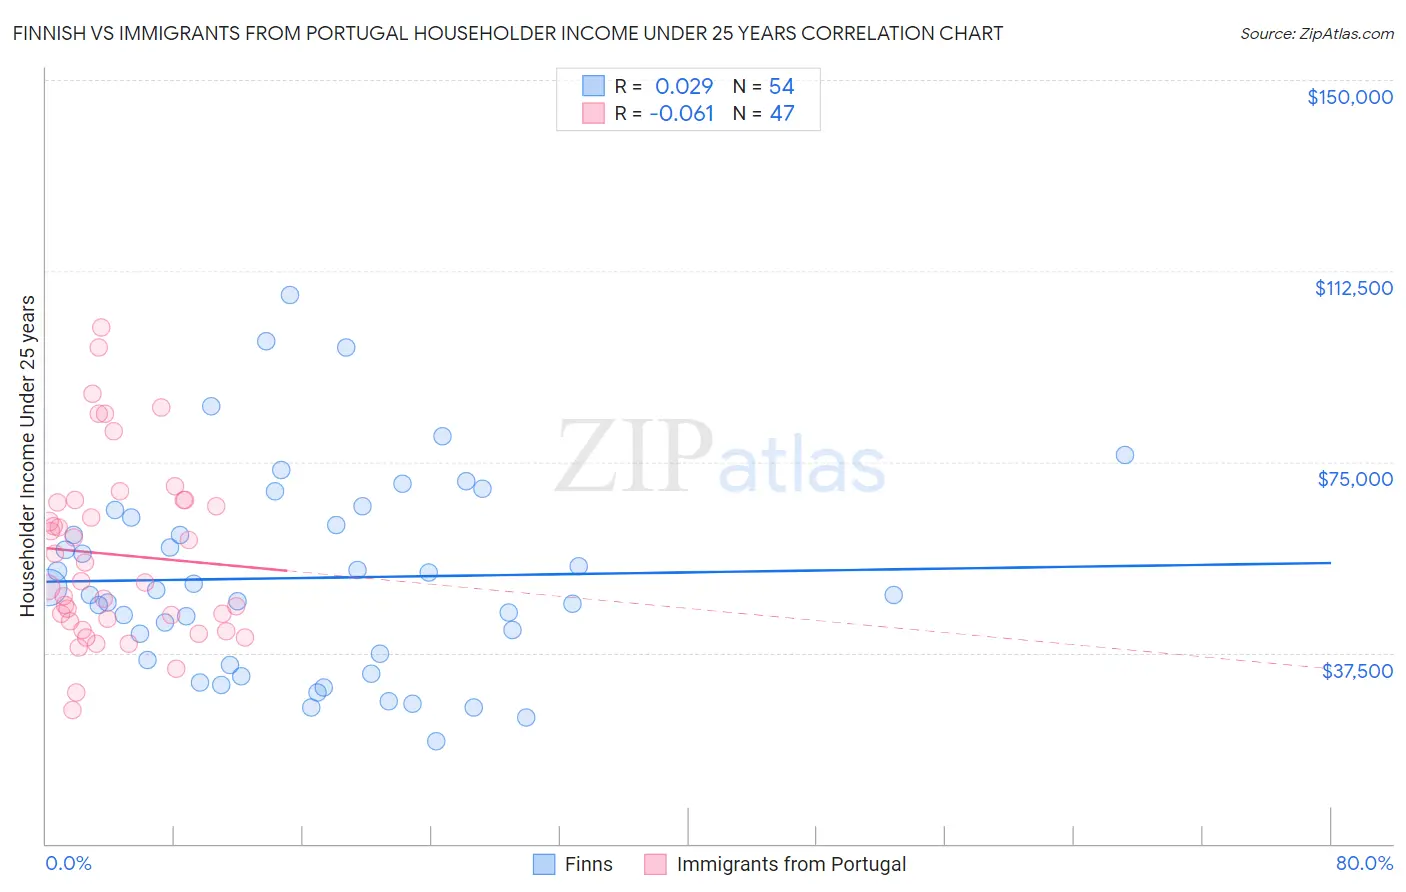
Finnish vs Immigrants from Portugal Householder Income Under 25 years Correlation Chart

The statistical analysis conducted on geographies consisting of 338,519,721 people shows no correlation between the proportion of Finns and household income with householder under the age of 25 in the United States with a correlation coefficient (R) of 0.029 and weighted average of $51,827. Similarly, the statistical analysis conducted on geographies consisting of 149,512,592 people shows a slight negative correlation between the proportion of Immigrants from Portugal and household income with householder under the age of 25 in the United States with a correlation coefficient (R) of -0.061 and weighted average of $54,105, a difference of 4.4%.
Finnish vs Immigrants from Portugal Householder Income Under 25 years

Householder Income Under 25 years Correlation Summary

MeasurementFinnishImmigrants from Portugal
Minimum$20,019$26,161
Maximum$107,709$101,440
Range$87,690$75,279
Mean$52,217$56,802
Median$49,349$51,667
Interquartile 25% (IQ1)$36,122$43,800
Interquartile 75% (IQ3)$63,954$67,515
Interquartile Range (IQR)$27,832$23,715
Standard Deviation (Sample)$19,708$17,633
Standard Deviation (Population)$19,525$17,444

Similar Demographics by Householder Income Under 25 years

Demographics Similar to Finns by Householder Income Under 25 years

In terms of householder income under 25 years, the demographic groups most similar to Finns are Basque ($51,818, a difference of 0.020%), Immigrants from England ($51,817, a difference of 0.020%), British West Indian ($51,844, a difference of 0.030%), European ($51,796, a difference of 0.060%), and Jordanian ($51,796, a difference of 0.060%).
DemographicsRating | RankHouseholder Income Under 25 years
Immigrants | Uruguay
56.8
/100
|
#171
Average
$52,302
Cypriots
51.2
/100
|
#172
Average
$52,209
Barbadians
50.8
/100
|
#173
Average
$52,202
Immigrants | Western Asia
50.0
/100
|
#174
Average
$52,190
Immigrants | Zimbabwe
33.8
/100
|
#175
Fair
$51,914
Austrians
32.9
/100
|
#176
Fair
$51,898
British West Indians
30.0
/100
|
#177
Fair
$51,844
Finns
29.2
/100
|
#178
Fair
$51,827
Basques
28.7
/100
|
#179
Fair
$51,818
Immigrants | England
28.7
/100
|
#180
Fair
$51,817
Europeans
27.6
/100
|
#181
Fair
$51,796
Jordanians
27.6
/100
|
#182
Fair
$51,796
Mexican American Indians
27.0
/100
|
#183
Fair
$51,783
Paiute
25.1
/100
|
#184
Fair
$51,743
Immigrants | Latvia
24.8
/100
|
#185
Fair
$51,737

Demographics Similar to Immigrants from Portugal by Householder Income Under 25 years

In terms of householder income under 25 years, the demographic groups most similar to Immigrants from Portugal are Eastern European ($54,066, a difference of 0.070%), Argentinean ($54,154, a difference of 0.090%), Immigrants from Malaysia ($54,179, a difference of 0.14%), Immigrants from Sierra Leone ($54,190, a difference of 0.16%), and Immigrants from Argentina ($54,209, a difference of 0.19%).
DemographicsRating | RankHouseholder Income Under 25 years
Turks
99.4
/100
|
#90
Exceptional
$54,266
Immigrants | Egypt
99.3
/100
|
#91
Exceptional
$54,239
Immigrants | St. Vincent and the Grenadines
99.3
/100
|
#92
Exceptional
$54,230
Immigrants | Argentina
99.3
/100
|
#93
Exceptional
$54,209
Immigrants | Sierra Leone
99.3
/100
|
#94
Exceptional
$54,190
Immigrants | Malaysia
99.2
/100
|
#95
Exceptional
$54,179
Argentineans
99.2
/100
|
#96
Exceptional
$54,154
Immigrants | Portugal
99.1
/100
|
#97
Exceptional
$54,105
Eastern Europeans
99.0
/100
|
#98
Exceptional
$54,066
Alaska Natives
98.8
/100
|
#99
Exceptional
$54,000
Immigrants | Kazakhstan
98.8
/100
|
#100
Exceptional
$53,990
South Americans
98.6
/100
|
#101
Exceptional
$53,939
Ecuadorians
98.5
/100
|
#102
Exceptional
$53,911
Ukrainians
98.3
/100
|
#103
Exceptional
$53,843
Ethiopians
98.2
/100
|
#104
Exceptional
$53,818