Ute vs Kenyan Median Male Earnings
COMPARE
Ute
Kenyan
Median Male Earnings
Median Male Earnings Comparison
Ute
Kenyans
$48,899
MEDIAN MALE EARNINGS
0.4/ 100
METRIC RATING
268th/ 347
METRIC RANK
$53,647
MEDIAN MALE EARNINGS
30.4/ 100
METRIC RATING
193rd/ 347
METRIC RANK
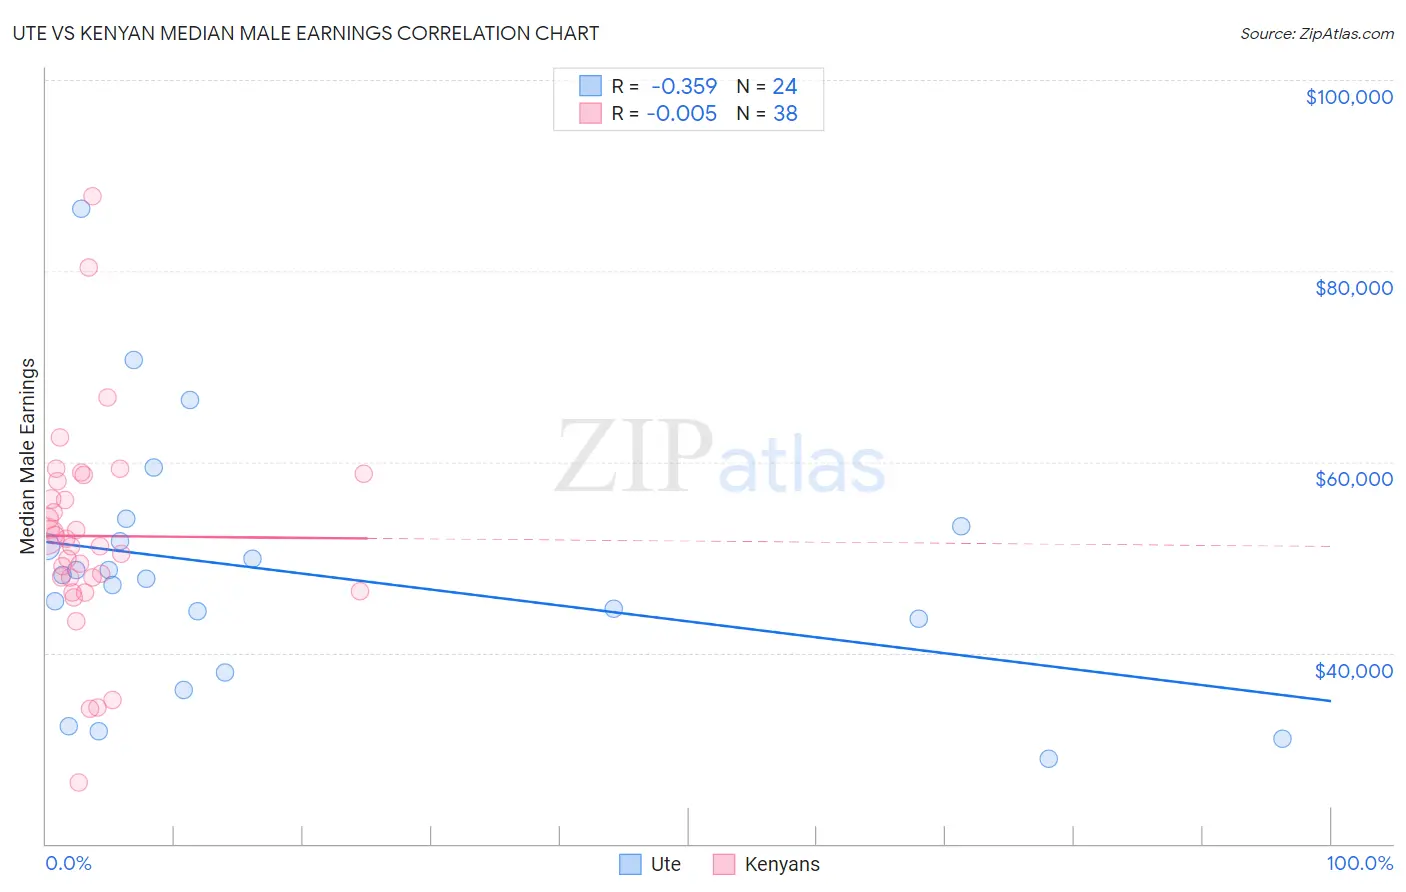
Ute vs Kenyan Median Male Earnings Correlation Chart
The statistical analysis conducted on geographies consisting of 55,657,801 people shows a mild negative correlation between the proportion of Ute and median male earnings in the United States with a correlation coefficient (R) of -0.359 and weighted average of $48,899. Similarly, the statistical analysis conducted on geographies consisting of 168,231,087 people shows no correlation between the proportion of Kenyans and median male earnings in the United States with a correlation coefficient (R) of -0.005 and weighted average of $53,647, a difference of 9.7%.
Median Male Earnings Correlation Summary
| Measurement | Ute | Kenyan |
| Minimum | $28,875 | $26,389 |
| Maximum | $86,490 | $87,784 |
| Range | $57,615 | $61,395 |
| Mean | $48,301 | $52,229 |
| Median | $47,968 | $51,523 |
| Interquartile 25% (IQ1) | $40,774 | $47,893 |
| Interquartile 75% (IQ3) | $52,454 | $57,971 |
| Interquartile Range (IQR) | $11,681 | $10,078 |
| Standard Deviation (Sample) | $13,224 | $11,163 |
| Standard Deviation (Population) | $12,945 | $11,016 |
Similar Demographics by Median Male Earnings
Demographics Similar to Ute by Median Male Earnings
In terms of median male earnings, the demographic groups most similar to Ute are Tsimshian ($48,836, a difference of 0.13%), Spanish American ($49,008, a difference of 0.22%), Somali ($49,025, a difference of 0.26%), Potawatomi ($48,768, a difference of 0.27%), and Cherokee ($48,669, a difference of 0.47%).
| Demographics | Rating | Rank | Median Male Earnings |
| Liberians | 0.6 /100 | #261 | Tragic $49,318 |
| Immigrants | West Indies | 0.6 /100 | #262 | Tragic $49,271 |
| Nicaraguans | 0.6 /100 | #263 | Tragic $49,215 |
| Immigrants | Middle Africa | 0.6 /100 | #264 | Tragic $49,201 |
| Immigrants | Laos | 0.6 /100 | #265 | Tragic $49,190 |
| Somalis | 0.5 /100 | #266 | Tragic $49,025 |
| Spanish Americans | 0.5 /100 | #267 | Tragic $49,008 |
| Ute | 0.4 /100 | #268 | Tragic $48,899 |
| Tsimshian | 0.4 /100 | #269 | Tragic $48,836 |
| Potawatomi | 0.4 /100 | #270 | Tragic $48,768 |
| Cherokee | 0.3 /100 | #271 | Tragic $48,669 |
| Salvadorans | 0.3 /100 | #272 | Tragic $48,646 |
| Jamaicans | 0.3 /100 | #273 | Tragic $48,632 |
| Colville | 0.3 /100 | #274 | Tragic $48,516 |
| Immigrants | Somalia | 0.3 /100 | #275 | Tragic $48,439 |
Demographics Similar to Kenyans by Median Male Earnings
In terms of median male earnings, the demographic groups most similar to Kenyans are Scotch-Irish ($53,658, a difference of 0.020%), Guamanian/Chamorro ($53,661, a difference of 0.030%), Uruguayan ($53,680, a difference of 0.060%), Puget Sound Salish ($53,704, a difference of 0.11%), and Immigrants from Eastern Africa ($53,713, a difference of 0.12%).
| Demographics | Rating | Rank | Median Male Earnings |
| Colombians | 34.4 /100 | #186 | Fair $53,832 |
| Immigrants | Eritrea | 31.8 /100 | #187 | Fair $53,715 |
| Immigrants | Eastern Africa | 31.8 /100 | #188 | Fair $53,713 |
| Puget Sound Salish | 31.6 /100 | #189 | Fair $53,704 |
| Uruguayans | 31.1 /100 | #190 | Fair $53,680 |
| Guamanians/Chamorros | 30.7 /100 | #191 | Fair $53,661 |
| Scotch-Irish | 30.6 /100 | #192 | Fair $53,658 |
| Kenyans | 30.4 /100 | #193 | Fair $53,647 |
| Spanish | 29.0 /100 | #194 | Fair $53,576 |
| Immigrants | Azores | 27.5 /100 | #195 | Fair $53,503 |
| Immigrants | Africa | 26.6 /100 | #196 | Fair $53,457 |
| Immigrants | Kenya | 26.0 /100 | #197 | Fair $53,427 |
| Immigrants | Costa Rica | 22.6 /100 | #198 | Fair $53,237 |
| Tongans | 22.3 /100 | #199 | Fair $53,218 |
| Immigrants | Thailand | 17.5 /100 | #200 | Poor $52,908 |