Pueblo vs Kenyan Median Male Earnings
COMPARE
Pueblo
Kenyan
Median Male Earnings
Median Male Earnings Comparison
Pueblo
Kenyans
$41,314
MEDIAN MALE EARNINGS
0.0/ 100
METRIC RATING
344th/ 347
METRIC RANK
$53,647
MEDIAN MALE EARNINGS
30.4/ 100
METRIC RATING
193rd/ 347
METRIC RANK
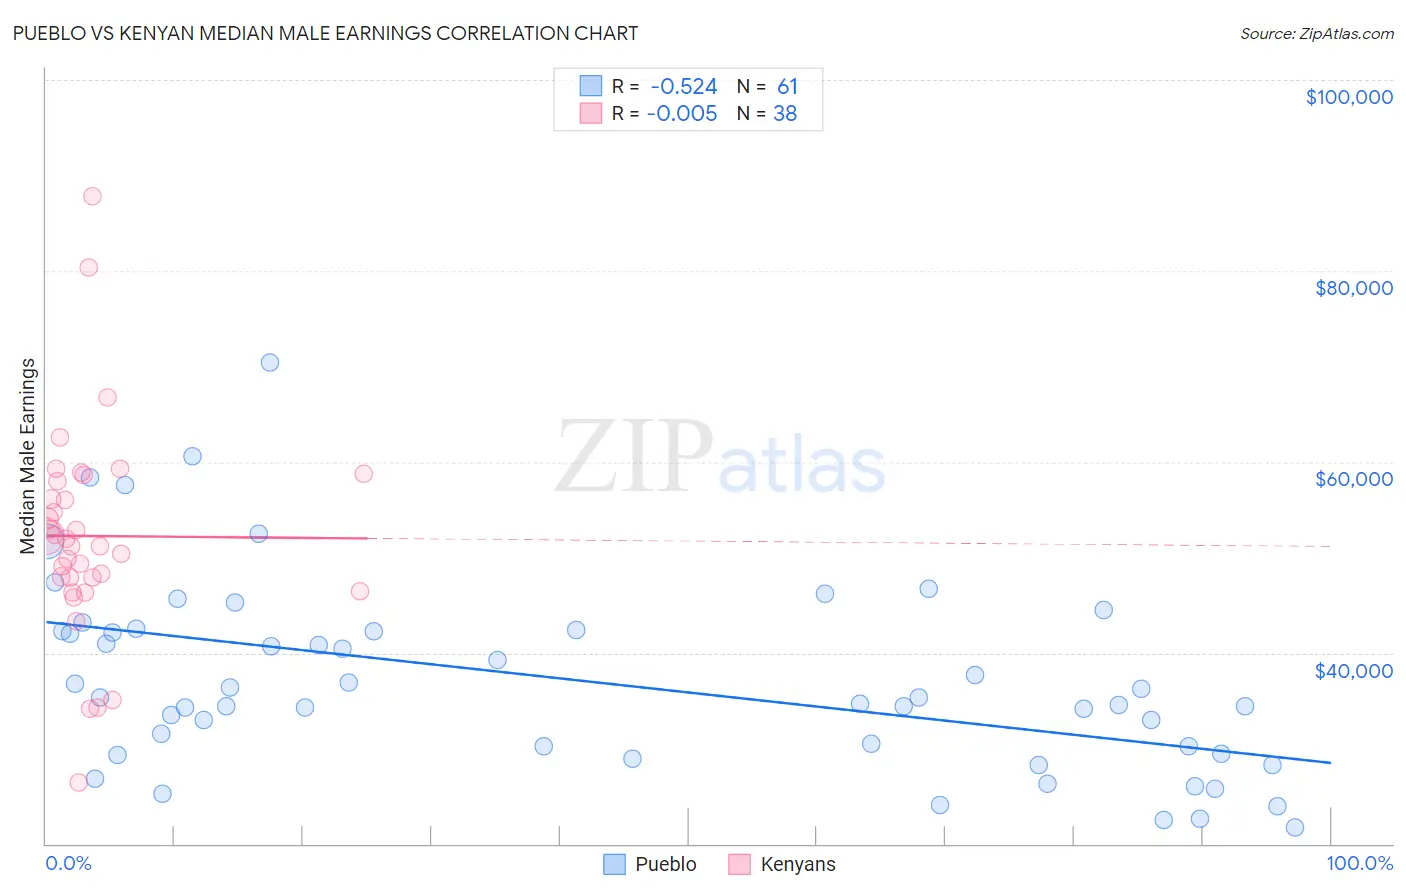
Pueblo vs Kenyan Median Male Earnings Correlation Chart
The statistical analysis conducted on geographies consisting of 120,058,056 people shows a substantial negative correlation between the proportion of Pueblo and median male earnings in the United States with a correlation coefficient (R) of -0.524 and weighted average of $41,314. Similarly, the statistical analysis conducted on geographies consisting of 168,231,087 people shows no correlation between the proportion of Kenyans and median male earnings in the United States with a correlation coefficient (R) of -0.005 and weighted average of $53,647, a difference of 29.8%.
Median Male Earnings Correlation Summary
| Measurement | Pueblo | Kenyan |
| Minimum | $21,750 | $26,389 |
| Maximum | $70,357 | $87,784 |
| Range | $48,607 | $61,395 |
| Mean | $37,142 | $52,229 |
| Median | $35,266 | $51,523 |
| Interquartile 25% (IQ1) | $29,777 | $47,893 |
| Interquartile 75% (IQ3) | $42,334 | $57,971 |
| Interquartile Range (IQR) | $12,557 | $10,078 |
| Standard Deviation (Sample) | $9,968 | $11,163 |
| Standard Deviation (Population) | $9,886 | $11,016 |
Similar Demographics by Median Male Earnings
Demographics Similar to Pueblo by Median Male Earnings
In terms of median male earnings, the demographic groups most similar to Pueblo are Lumbee ($41,715, a difference of 0.97%), Arapaho ($41,758, a difference of 1.1%), Hopi ($42,060, a difference of 1.8%), Navajo ($42,098, a difference of 1.9%), and Pima ($42,357, a difference of 2.5%).
| Demographics | Rating | Rank | Median Male Earnings |
| Immigrants | Congo | 0.0 /100 | #333 | Tragic $44,204 |
| Immigrants | Yemen | 0.0 /100 | #334 | Tragic $44,083 |
| Spanish American Indians | 0.0 /100 | #335 | Tragic $44,010 |
| Immigrants | Cuba | 0.0 /100 | #336 | Tragic $43,461 |
| Menominee | 0.0 /100 | #337 | Tragic $42,581 |
| Crow | 0.0 /100 | #338 | Tragic $42,434 |
| Pima | 0.0 /100 | #339 | Tragic $42,357 |
| Navajo | 0.0 /100 | #340 | Tragic $42,098 |
| Hopi | 0.0 /100 | #341 | Tragic $42,060 |
| Arapaho | 0.0 /100 | #342 | Tragic $41,758 |
| Lumbee | 0.0 /100 | #343 | Tragic $41,715 |
| Pueblo | 0.0 /100 | #344 | Tragic $41,314 |
| Puerto Ricans | 0.0 /100 | #345 | Tragic $40,071 |
| Tohono O'odham | 0.0 /100 | #346 | Tragic $39,543 |
| Yup'ik | 0.0 /100 | #347 | Tragic $39,504 |
Demographics Similar to Kenyans by Median Male Earnings
In terms of median male earnings, the demographic groups most similar to Kenyans are Scotch-Irish ($53,658, a difference of 0.020%), Guamanian/Chamorro ($53,661, a difference of 0.030%), Uruguayan ($53,680, a difference of 0.060%), Puget Sound Salish ($53,704, a difference of 0.11%), and Immigrants from Eastern Africa ($53,713, a difference of 0.12%).
| Demographics | Rating | Rank | Median Male Earnings |
| Colombians | 34.4 /100 | #186 | Fair $53,832 |
| Immigrants | Eritrea | 31.8 /100 | #187 | Fair $53,715 |
| Immigrants | Eastern Africa | 31.8 /100 | #188 | Fair $53,713 |
| Puget Sound Salish | 31.6 /100 | #189 | Fair $53,704 |
| Uruguayans | 31.1 /100 | #190 | Fair $53,680 |
| Guamanians/Chamorros | 30.7 /100 | #191 | Fair $53,661 |
| Scotch-Irish | 30.6 /100 | #192 | Fair $53,658 |
| Kenyans | 30.4 /100 | #193 | Fair $53,647 |
| Spanish | 29.0 /100 | #194 | Fair $53,576 |
| Immigrants | Azores | 27.5 /100 | #195 | Fair $53,503 |
| Immigrants | Africa | 26.6 /100 | #196 | Fair $53,457 |
| Immigrants | Kenya | 26.0 /100 | #197 | Fair $53,427 |
| Immigrants | Costa Rica | 22.6 /100 | #198 | Fair $53,237 |
| Tongans | 22.3 /100 | #199 | Fair $53,218 |
| Immigrants | Thailand | 17.5 /100 | #200 | Poor $52,908 |