Finnish vs Colombian Child Poverty Under the Age of 16
COMPARE
Finnish
Colombian
Child Poverty Under the Age of 16
Child Poverty Under the Age of 16 Comparison
Finns
Colombians
14.5%
CHILD POVERTY UNDER THE AGE OF 16
97.2/ 100
METRIC RATING
81st/ 347
METRIC RANK
15.8%
CHILD POVERTY UNDER THE AGE OF 16
67.6/ 100
METRIC RATING
162nd/ 347
METRIC RANK
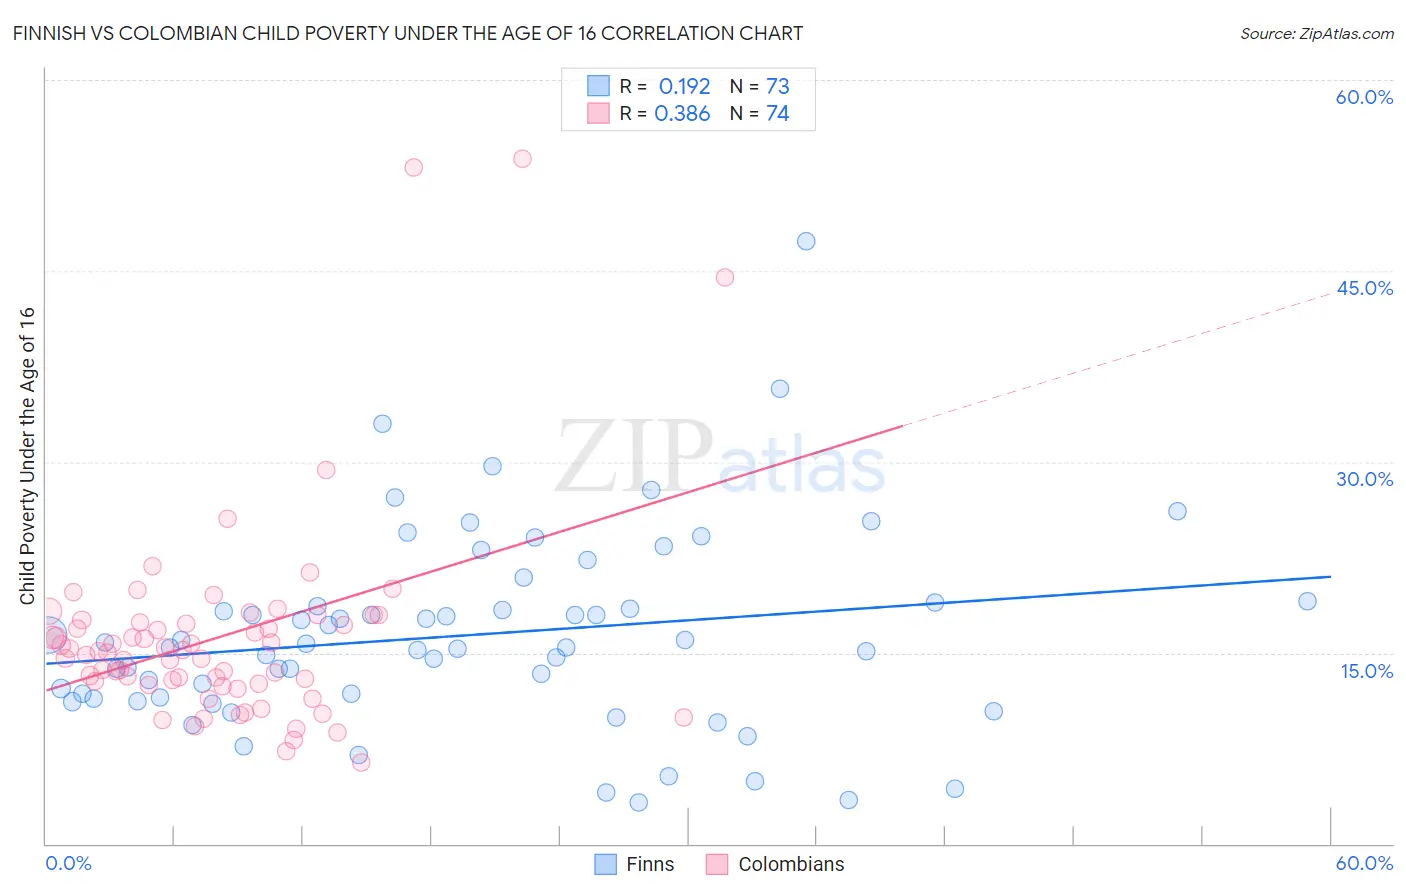
Finnish vs Colombian Child Poverty Under the Age of 16 Correlation Chart
The statistical analysis conducted on geographies consisting of 399,880,934 people shows a poor positive correlation between the proportion of Finns and poverty level among children under the age of 16 in the United States with a correlation coefficient (R) of 0.192 and weighted average of 14.5%. Similarly, the statistical analysis conducted on geographies consisting of 415,703,397 people shows a mild positive correlation between the proportion of Colombians and poverty level among children under the age of 16 in the United States with a correlation coefficient (R) of 0.386 and weighted average of 15.8%, a difference of 9.4%.
Child Poverty Under the Age of 16 Correlation Summary
| Measurement | Finnish | Colombian |
| Minimum | 3.2% | 6.4% |
| Maximum | 47.4% | 53.8% |
| Range | 44.1% | 47.4% |
| Mean | 16.4% | 16.2% |
| Median | 15.4% | 15.1% |
| Interquartile 25% (IQ1) | 11.4% | 12.6% |
| Interquartile 75% (IQ3) | 18.8% | 17.4% |
| Interquartile Range (IQR) | 7.4% | 4.8% |
| Standard Deviation (Sample) | 7.7% | 8.2% |
| Standard Deviation (Population) | 7.7% | 8.1% |
Similar Demographics by Child Poverty Under the Age of 16
Demographics Similar to Finns by Child Poverty Under the Age of 16
In terms of child poverty under the age of 16, the demographic groups most similar to Finns are Immigrants from North Macedonia (14.5%, a difference of 0.030%), Immigrants from Canada (14.5%, a difference of 0.030%), Egyptian (14.5%, a difference of 0.060%), Immigrants from Latvia (14.5%, a difference of 0.080%), and Swiss (14.5%, a difference of 0.10%).
| Demographics | Rating | Rank | Child Poverty Under the Age of 16 |
| Macedonians | 97.6 /100 | #74 | Exceptional 14.4% |
| Ukrainians | 97.5 /100 | #75 | Exceptional 14.4% |
| Immigrants | Eastern Europe | 97.5 /100 | #76 | Exceptional 14.4% |
| Australians | 97.5 /100 | #77 | Exceptional 14.4% |
| Immigrants | Russia | 97.3 /100 | #78 | Exceptional 14.5% |
| Swiss | 97.3 /100 | #79 | Exceptional 14.5% |
| Immigrants | North Macedonia | 97.2 /100 | #80 | Exceptional 14.5% |
| Finns | 97.2 /100 | #81 | Exceptional 14.5% |
| Immigrants | Canada | 97.2 /100 | #82 | Exceptional 14.5% |
| Egyptians | 97.2 /100 | #83 | Exceptional 14.5% |
| Immigrants | Latvia | 97.1 /100 | #84 | Exceptional 14.5% |
| Soviet Union | 97.1 /100 | #85 | Exceptional 14.5% |
| Immigrants | Argentina | 97.1 /100 | #86 | Exceptional 14.5% |
| Taiwanese | 97.1 /100 | #87 | Exceptional 14.5% |
| Northern Europeans | 97.0 /100 | #88 | Exceptional 14.5% |
Demographics Similar to Colombians by Child Poverty Under the Age of 16
In terms of child poverty under the age of 16, the demographic groups most similar to Colombians are Yugoslavian (15.8%, a difference of 0.0%), Immigrants from Germany (15.8%, a difference of 0.040%), Immigrants from Northern Africa (15.8%, a difference of 0.060%), Guamanian/Chamorro (15.9%, a difference of 0.17%), and Immigrants from Oceania (15.9%, a difference of 0.30%).
| Demographics | Rating | Rank | Child Poverty Under the Age of 16 |
| Syrians | 76.1 /100 | #155 | Good 15.6% |
| Immigrants | Venezuela | 74.9 /100 | #156 | Good 15.7% |
| Immigrants | Nepal | 72.9 /100 | #157 | Good 15.7% |
| Immigrants | Chile | 72.8 /100 | #158 | Good 15.7% |
| Immigrants | Fiji | 71.1 /100 | #159 | Good 15.8% |
| Immigrants | Albania | 70.7 /100 | #160 | Good 15.8% |
| Immigrants | Northern Africa | 68.1 /100 | #161 | Good 15.8% |
| Colombians | 67.6 /100 | #162 | Good 15.8% |
| Yugoslavians | 67.6 /100 | #163 | Good 15.8% |
| Immigrants | Germany | 67.3 /100 | #164 | Good 15.8% |
| Guamanians/Chamorros | 66.4 /100 | #165 | Good 15.9% |
| Immigrants | Oceania | 65.4 /100 | #166 | Good 15.9% |
| Costa Ricans | 61.1 /100 | #167 | Good 16.0% |
| South Americans | 57.9 /100 | #168 | Average 16.0% |
| Uruguayans | 54.7 /100 | #169 | Average 16.1% |