Fijian vs Turkish Median Family Income
COMPARE
Fijian
Turkish
Median Family Income
Median Family Income Comparison
Fijians
Turks
$87,387
MEDIAN FAMILY INCOME
0.0/ 100
METRIC RATING
294th/ 347
METRIC RANK
$121,202
MEDIAN FAMILY INCOME
100.0/ 100
METRIC RATING
25th/ 347
METRIC RANK
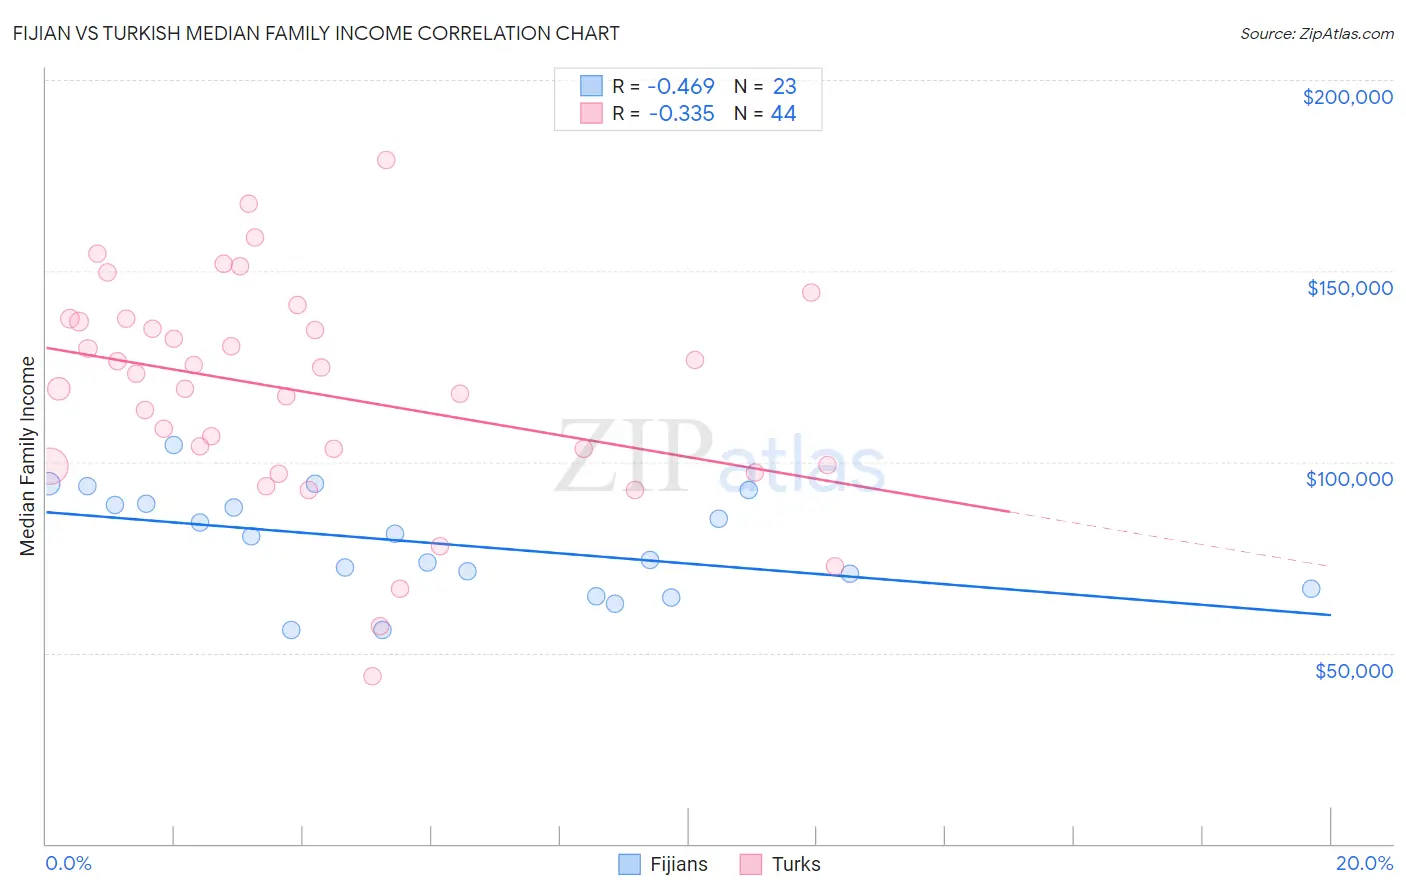
Fijian vs Turkish Median Family Income Correlation Chart
The statistical analysis conducted on geographies consisting of 55,946,812 people shows a moderate negative correlation between the proportion of Fijians and median family income in the United States with a correlation coefficient (R) of -0.469 and weighted average of $87,387. Similarly, the statistical analysis conducted on geographies consisting of 271,625,572 people shows a mild negative correlation between the proportion of Turks and median family income in the United States with a correlation coefficient (R) of -0.335 and weighted average of $121,202, a difference of 38.7%.
Median Family Income Correlation Summary
| Measurement | Fijian | Turkish |
| Minimum | $55,821 | $43,750 |
| Maximum | $104,335 | $179,091 |
| Range | $48,514 | $135,341 |
| Mean | $78,636 | $118,204 |
| Median | $80,363 | $121,237 |
| Interquartile 25% (IQ1) | $66,750 | $99,051 |
| Interquartile 75% (IQ3) | $89,066 | $137,062 |
| Interquartile Range (IQR) | $22,316 | $38,011 |
| Standard Deviation (Sample) | $13,442 | $28,920 |
| Standard Deviation (Population) | $13,146 | $28,590 |
Similar Demographics by Median Family Income
Demographics Similar to Fijians by Median Family Income
In terms of median family income, the demographic groups most similar to Fijians are Yaqui ($87,289, a difference of 0.11%), Immigrants from Guatemala ($87,191, a difference of 0.22%), Ute ($87,596, a difference of 0.24%), Cajun ($87,157, a difference of 0.26%), and Immigrants from Latin America ($86,989, a difference of 0.46%).
| Demographics | Rating | Rank | Median Family Income |
| Potawatomi | 0.1 /100 | #287 | Tragic $88,265 |
| Cherokee | 0.1 /100 | #288 | Tragic $88,209 |
| Central American Indians | 0.1 /100 | #289 | Tragic $88,034 |
| Shoshone | 0.1 /100 | #290 | Tragic $87,872 |
| Immigrants | Cabo Verde | 0.1 /100 | #291 | Tragic $87,830 |
| Africans | 0.1 /100 | #292 | Tragic $87,820 |
| Ute | 0.0 /100 | #293 | Tragic $87,596 |
| Fijians | 0.0 /100 | #294 | Tragic $87,387 |
| Yaqui | 0.0 /100 | #295 | Tragic $87,289 |
| Immigrants | Guatemala | 0.0 /100 | #296 | Tragic $87,191 |
| Cajuns | 0.0 /100 | #297 | Tragic $87,157 |
| Immigrants | Latin America | 0.0 /100 | #298 | Tragic $86,989 |
| Chippewa | 0.0 /100 | #299 | Tragic $86,852 |
| Ottawa | 0.0 /100 | #300 | Tragic $86,380 |
| Colville | 0.0 /100 | #301 | Tragic $85,792 |
Demographics Similar to Turks by Median Family Income
In terms of median family income, the demographic groups most similar to Turks are Immigrants from Switzerland ($120,726, a difference of 0.39%), Immigrants from Northern Europe ($121,840, a difference of 0.53%), Russian ($120,487, a difference of 0.59%), Immigrants from Denmark ($120,445, a difference of 0.63%), and Latvian ($120,301, a difference of 0.75%).
| Demographics | Rating | Rank | Median Family Income |
| Immigrants | Eastern Asia | 100.0 /100 | #18 | Exceptional $125,150 |
| Immigrants | Belgium | 100.0 /100 | #19 | Exceptional $123,831 |
| Burmese | 100.0 /100 | #20 | Exceptional $123,369 |
| Immigrants | Korea | 100.0 /100 | #21 | Exceptional $122,800 |
| Immigrants | Sweden | 100.0 /100 | #22 | Exceptional $122,765 |
| Immigrants | Japan | 100.0 /100 | #23 | Exceptional $122,764 |
| Immigrants | Northern Europe | 100.0 /100 | #24 | Exceptional $121,840 |
| Turks | 100.0 /100 | #25 | Exceptional $121,202 |
| Immigrants | Switzerland | 100.0 /100 | #26 | Exceptional $120,726 |
| Russians | 100.0 /100 | #27 | Exceptional $120,487 |
| Immigrants | Denmark | 100.0 /100 | #28 | Exceptional $120,445 |
| Latvians | 100.0 /100 | #29 | Exceptional $120,301 |
| Immigrants | Sri Lanka | 100.0 /100 | #30 | Exceptional $120,263 |
| Immigrants | France | 100.0 /100 | #31 | Exceptional $120,076 |
| Asians | 100.0 /100 | #32 | Exceptional $119,955 |