Fijian vs Immigrants from Middle Africa Median Female Earnings
COMPARE
Fijian
Immigrants from Middle Africa
Median Female Earnings
Median Female Earnings Comparison
Fijians
Immigrants from Middle Africa
$35,114
MEDIAN FEMALE EARNINGS
0.0/ 100
METRIC RATING
306th/ 347
METRIC RANK
$37,965
MEDIAN FEMALE EARNINGS
2.7/ 100
METRIC RATING
245th/ 347
METRIC RANK
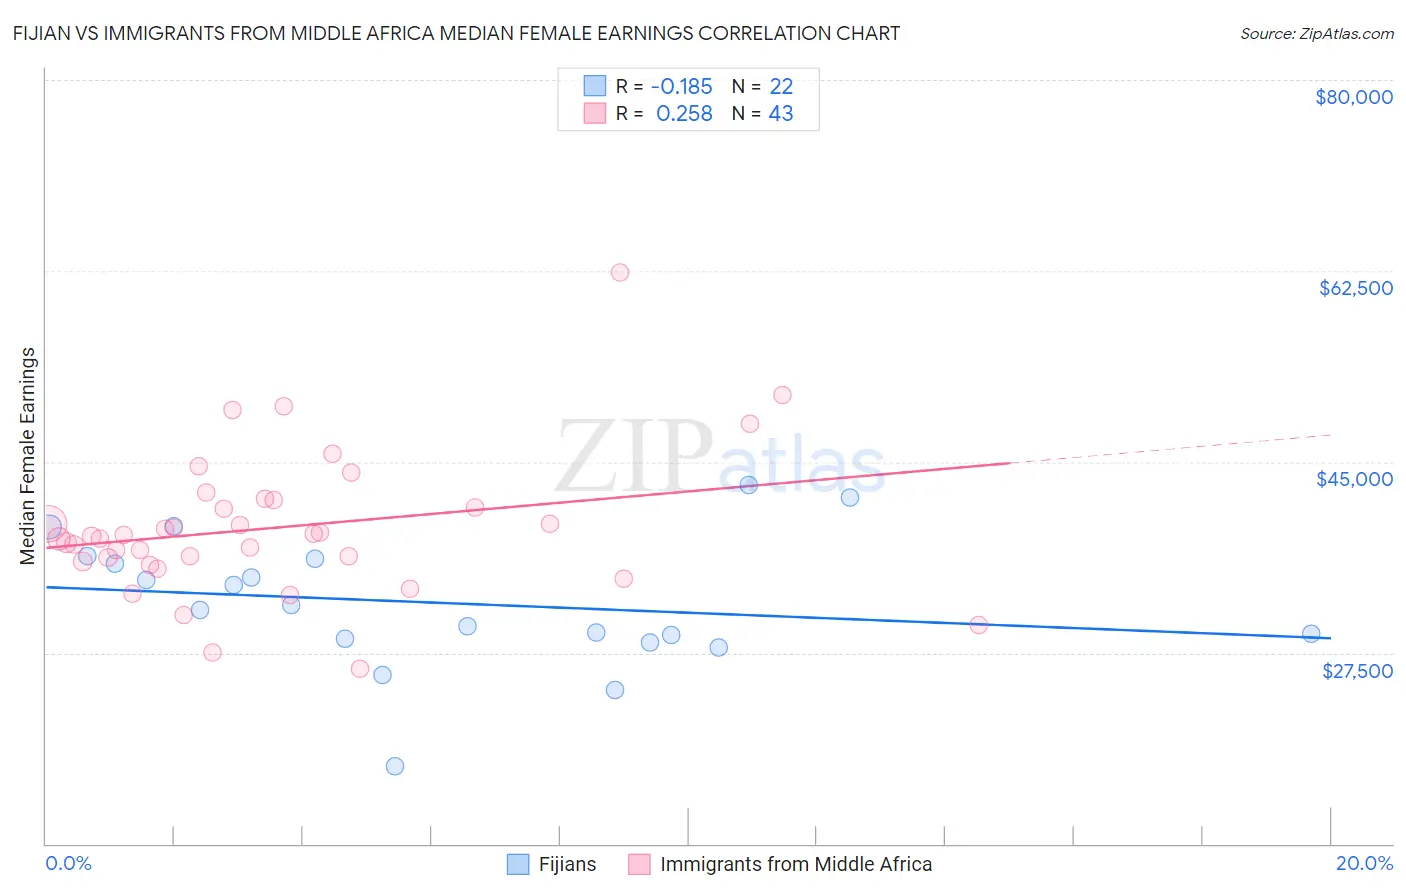
Fijian vs Immigrants from Middle Africa Median Female Earnings Correlation Chart
The statistical analysis conducted on geographies consisting of 55,944,407 people shows a poor negative correlation between the proportion of Fijians and median female earnings in the United States with a correlation coefficient (R) of -0.185 and weighted average of $35,114. Similarly, the statistical analysis conducted on geographies consisting of 202,702,716 people shows a weak positive correlation between the proportion of Immigrants from Middle Africa and median female earnings in the United States with a correlation coefficient (R) of 0.258 and weighted average of $37,965, a difference of 8.1%.
Median Female Earnings Correlation Summary
| Measurement | Fijian | Immigrants from Middle Africa |
| Minimum | $17,125 | $26,014 |
| Maximum | $42,895 | $62,334 |
| Range | $25,770 | $36,320 |
| Mean | $32,097 | $39,010 |
| Median | $31,625 | $38,230 |
| Interquartile 25% (IQ1) | $28,766 | $35,893 |
| Interquartile 75% (IQ3) | $36,076 | $41,514 |
| Interquartile Range (IQR) | $7,310 | $5,621 |
| Standard Deviation (Sample) | $6,055 | $6,561 |
| Standard Deviation (Population) | $5,916 | $6,484 |
Similar Demographics by Median Female Earnings
Demographics Similar to Fijians by Median Female Earnings
In terms of median female earnings, the demographic groups most similar to Fijians are Bahamian ($35,125, a difference of 0.030%), Sioux ($35,063, a difference of 0.15%), Immigrants from Bahamas ($35,027, a difference of 0.25%), Honduran ($35,013, a difference of 0.29%), and Chippewa ($35,003, a difference of 0.32%).
| Demographics | Rating | Rank | Median Female Earnings |
| Immigrants | Guatemala | 0.0 /100 | #299 | Tragic $35,444 |
| Yuman | 0.0 /100 | #300 | Tragic $35,377 |
| Pima | 0.0 /100 | #301 | Tragic $35,326 |
| Blacks/African Americans | 0.0 /100 | #302 | Tragic $35,315 |
| Immigrants | Latin America | 0.0 /100 | #303 | Tragic $35,307 |
| Crow | 0.0 /100 | #304 | Tragic $35,266 |
| Bahamians | 0.0 /100 | #305 | Tragic $35,125 |
| Fijians | 0.0 /100 | #306 | Tragic $35,114 |
| Sioux | 0.0 /100 | #307 | Tragic $35,063 |
| Immigrants | Bahamas | 0.0 /100 | #308 | Tragic $35,027 |
| Hondurans | 0.0 /100 | #309 | Tragic $35,013 |
| Chippewa | 0.0 /100 | #310 | Tragic $35,003 |
| Ute | 0.0 /100 | #311 | Tragic $34,960 |
| Yaqui | 0.0 /100 | #312 | Tragic $34,943 |
| Cubans | 0.0 /100 | #313 | Tragic $34,942 |
Demographics Similar to Immigrants from Middle Africa by Median Female Earnings
In terms of median female earnings, the demographic groups most similar to Immigrants from Middle Africa are Delaware ($37,964, a difference of 0.0%), Immigrants from Liberia ($37,970, a difference of 0.010%), German ($37,986, a difference of 0.050%), Immigrants from Somalia ($37,914, a difference of 0.14%), and Alaskan Athabascan ($37,905, a difference of 0.16%).
| Demographics | Rating | Rank | Median Female Earnings |
| Alaska Natives | 4.3 /100 | #238 | Tragic $38,202 |
| English | 4.2 /100 | #239 | Tragic $38,196 |
| Finns | 4.0 /100 | #240 | Tragic $38,173 |
| Spanish | 3.5 /100 | #241 | Tragic $38,098 |
| Immigrants | Burma/Myanmar | 3.0 /100 | #242 | Tragic $38,028 |
| Germans | 2.8 /100 | #243 | Tragic $37,986 |
| Immigrants | Liberia | 2.7 /100 | #244 | Tragic $37,970 |
| Immigrants | Middle Africa | 2.7 /100 | #245 | Tragic $37,965 |
| Delaware | 2.6 /100 | #246 | Tragic $37,964 |
| Immigrants | Somalia | 2.4 /100 | #247 | Tragic $37,914 |
| Alaskan Athabascans | 2.3 /100 | #248 | Tragic $37,905 |
| Swiss | 2.3 /100 | #249 | Tragic $37,904 |
| Immigrants | Iraq | 2.2 /100 | #250 | Tragic $37,864 |
| Welsh | 2.1 /100 | #251 | Tragic $37,856 |
| Immigrants | Dominica | 2.0 /100 | #252 | Tragic $37,825 |