Fijian vs Immigrants from Morocco Median Family Income
COMPARE
Fijian
Immigrants from Morocco
Median Family Income
Median Family Income Comparison
Fijians
Immigrants from Morocco
$87,387
MEDIAN FAMILY INCOME
0.0/ 100
METRIC RATING
294th/ 347
METRIC RANK
$105,964
MEDIAN FAMILY INCOME
84.3/ 100
METRIC RATING
144th/ 347
METRIC RANK
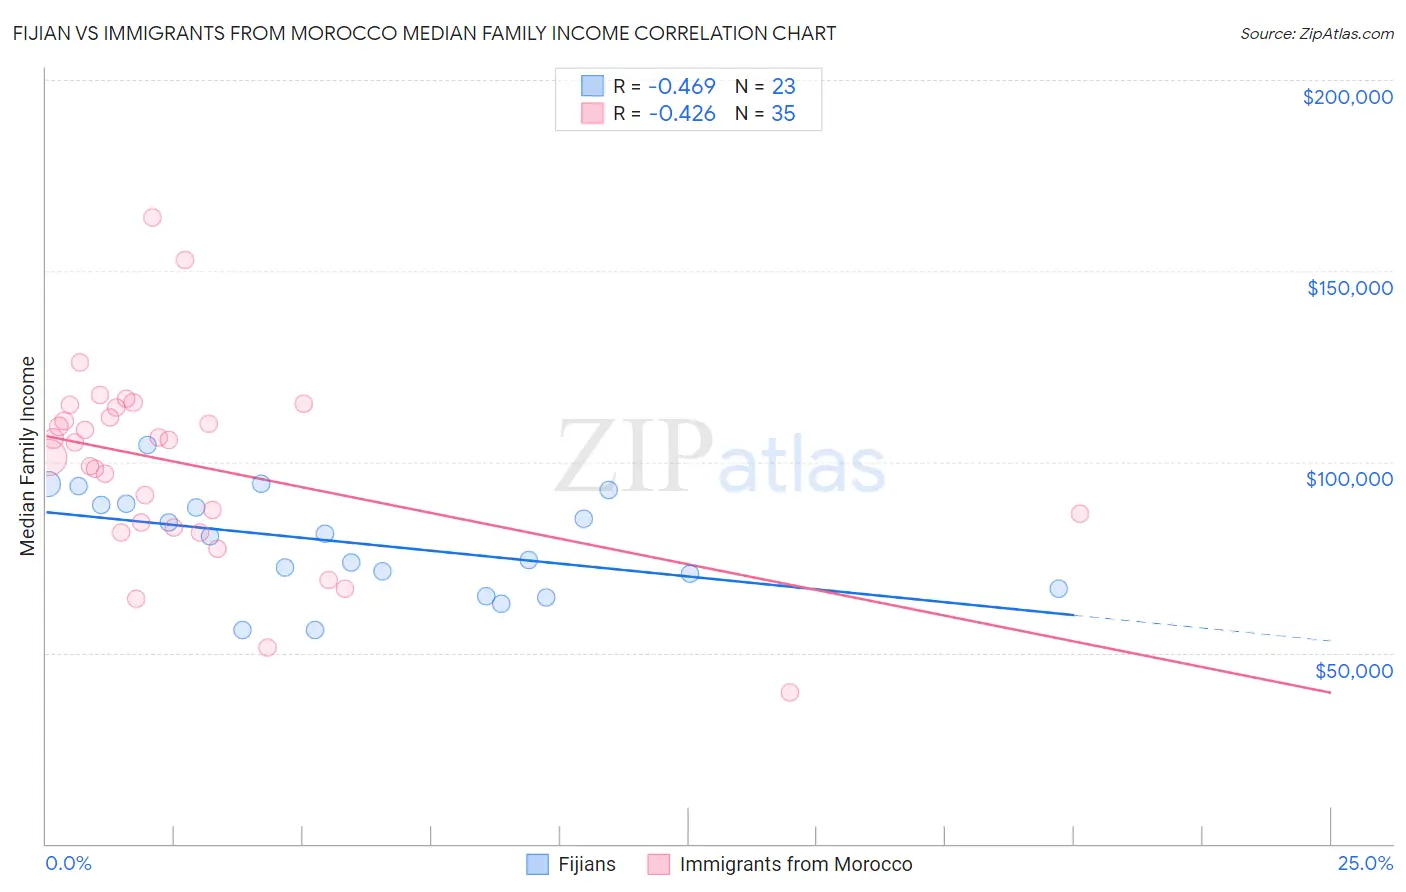
Fijian vs Immigrants from Morocco Median Family Income Correlation Chart
The statistical analysis conducted on geographies consisting of 55,946,812 people shows a moderate negative correlation between the proportion of Fijians and median family income in the United States with a correlation coefficient (R) of -0.469 and weighted average of $87,387. Similarly, the statistical analysis conducted on geographies consisting of 178,905,802 people shows a moderate negative correlation between the proportion of Immigrants from Morocco and median family income in the United States with a correlation coefficient (R) of -0.426 and weighted average of $105,964, a difference of 21.3%.
Median Family Income Correlation Summary
| Measurement | Fijian | Immigrants from Morocco |
| Minimum | $55,821 | $39,712 |
| Maximum | $104,335 | $163,880 |
| Range | $48,514 | $124,168 |
| Mean | $78,636 | $99,080 |
| Median | $80,363 | $105,156 |
| Interquartile 25% (IQ1) | $66,750 | $82,830 |
| Interquartile 75% (IQ3) | $89,066 | $114,323 |
| Interquartile Range (IQR) | $22,316 | $31,493 |
| Standard Deviation (Sample) | $13,442 | $24,961 |
| Standard Deviation (Population) | $13,146 | $24,602 |
Similar Demographics by Median Family Income
Demographics Similar to Fijians by Median Family Income
In terms of median family income, the demographic groups most similar to Fijians are Yaqui ($87,289, a difference of 0.11%), Immigrants from Guatemala ($87,191, a difference of 0.22%), Ute ($87,596, a difference of 0.24%), Cajun ($87,157, a difference of 0.26%), and Immigrants from Latin America ($86,989, a difference of 0.46%).
| Demographics | Rating | Rank | Median Family Income |
| Potawatomi | 0.1 /100 | #287 | Tragic $88,265 |
| Cherokee | 0.1 /100 | #288 | Tragic $88,209 |
| Central American Indians | 0.1 /100 | #289 | Tragic $88,034 |
| Shoshone | 0.1 /100 | #290 | Tragic $87,872 |
| Immigrants | Cabo Verde | 0.1 /100 | #291 | Tragic $87,830 |
| Africans | 0.1 /100 | #292 | Tragic $87,820 |
| Ute | 0.0 /100 | #293 | Tragic $87,596 |
| Fijians | 0.0 /100 | #294 | Tragic $87,387 |
| Yaqui | 0.0 /100 | #295 | Tragic $87,289 |
| Immigrants | Guatemala | 0.0 /100 | #296 | Tragic $87,191 |
| Cajuns | 0.0 /100 | #297 | Tragic $87,157 |
| Immigrants | Latin America | 0.0 /100 | #298 | Tragic $86,989 |
| Chippewa | 0.0 /100 | #299 | Tragic $86,852 |
| Ottawa | 0.0 /100 | #300 | Tragic $86,380 |
| Colville | 0.0 /100 | #301 | Tragic $85,792 |
Demographics Similar to Immigrants from Morocco by Median Family Income
In terms of median family income, the demographic groups most similar to Immigrants from Morocco are Tongan ($105,967, a difference of 0.0%), Slovene ($106,020, a difference of 0.050%), Danish ($105,900, a difference of 0.060%), Czech ($105,839, a difference of 0.12%), and Immigrants from Syria ($106,118, a difference of 0.15%).
| Demographics | Rating | Rank | Median Family Income |
| Immigrants | Uganda | 85.7 /100 | #137 | Excellent $106,188 |
| Immigrants | Vietnam | 85.7 /100 | #138 | Excellent $106,186 |
| Luxembourgers | 85.7 /100 | #139 | Excellent $106,183 |
| Norwegians | 85.5 /100 | #140 | Excellent $106,144 |
| Immigrants | Syria | 85.3 /100 | #141 | Excellent $106,118 |
| Slovenes | 84.7 /100 | #142 | Excellent $106,020 |
| Tongans | 84.3 /100 | #143 | Excellent $105,967 |
| Immigrants | Morocco | 84.3 /100 | #144 | Excellent $105,964 |
| Danes | 83.8 /100 | #145 | Excellent $105,900 |
| Czechs | 83.4 /100 | #146 | Excellent $105,839 |
| Immigrants | Chile | 82.1 /100 | #147 | Excellent $105,655 |
| Hungarians | 81.7 /100 | #148 | Excellent $105,609 |
| Immigrants | Germany | 80.9 /100 | #149 | Excellent $105,507 |
| Irish | 80.5 /100 | #150 | Excellent $105,453 |
| Peruvians | 80.4 /100 | #151 | Excellent $105,444 |