Fijian vs Immigrants from Jordan Median Family Income
COMPARE
Fijian
Immigrants from Jordan
Median Family Income
Median Family Income Comparison
Fijians
Immigrants from Jordan
$87,387
MEDIAN FAMILY INCOME
0.0/ 100
METRIC RATING
294th/ 347
METRIC RANK
$107,715
MEDIAN FAMILY INCOME
92.9/ 100
METRIC RATING
122nd/ 347
METRIC RANK
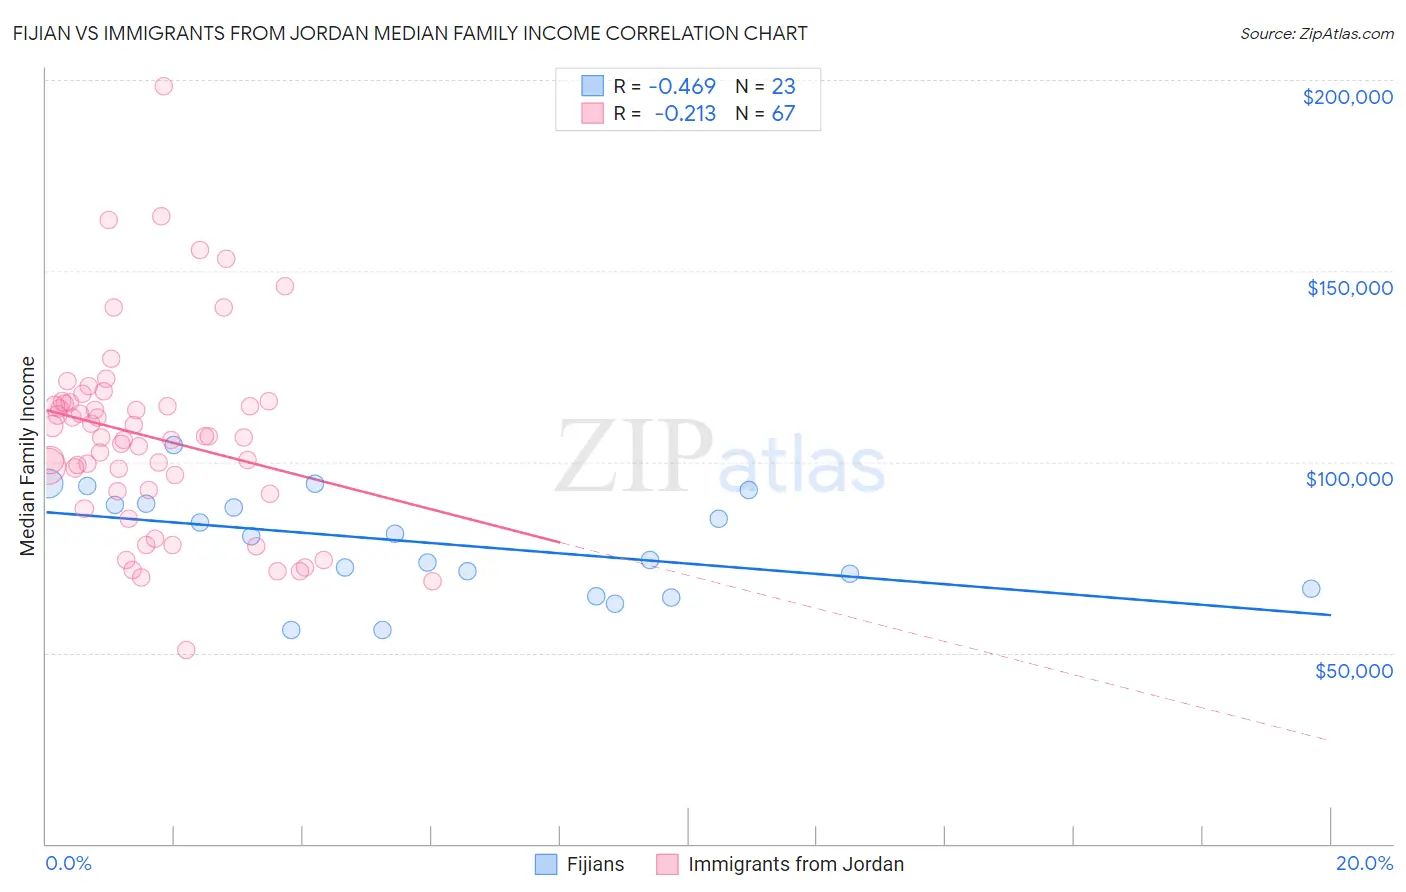
Fijian vs Immigrants from Jordan Median Family Income Correlation Chart
The statistical analysis conducted on geographies consisting of 55,946,812 people shows a moderate negative correlation between the proportion of Fijians and median family income in the United States with a correlation coefficient (R) of -0.469 and weighted average of $87,387. Similarly, the statistical analysis conducted on geographies consisting of 181,223,835 people shows a weak negative correlation between the proportion of Immigrants from Jordan and median family income in the United States with a correlation coefficient (R) of -0.213 and weighted average of $107,715, a difference of 23.3%.
Median Family Income Correlation Summary
| Measurement | Fijian | Immigrants from Jordan |
| Minimum | $55,821 | $50,608 |
| Maximum | $104,335 | $198,467 |
| Range | $48,514 | $147,858 |
| Mean | $78,636 | $106,593 |
| Median | $80,363 | $106,540 |
| Interquartile 25% (IQ1) | $66,750 | $92,338 |
| Interquartile 75% (IQ3) | $89,066 | $115,517 |
| Interquartile Range (IQR) | $22,316 | $23,179 |
| Standard Deviation (Sample) | $13,442 | $25,689 |
| Standard Deviation (Population) | $13,146 | $25,497 |
Similar Demographics by Median Family Income
Demographics Similar to Fijians by Median Family Income
In terms of median family income, the demographic groups most similar to Fijians are Yaqui ($87,289, a difference of 0.11%), Immigrants from Guatemala ($87,191, a difference of 0.22%), Ute ($87,596, a difference of 0.24%), Cajun ($87,157, a difference of 0.26%), and Immigrants from Latin America ($86,989, a difference of 0.46%).
| Demographics | Rating | Rank | Median Family Income |
| Potawatomi | 0.1 /100 | #287 | Tragic $88,265 |
| Cherokee | 0.1 /100 | #288 | Tragic $88,209 |
| Central American Indians | 0.1 /100 | #289 | Tragic $88,034 |
| Shoshone | 0.1 /100 | #290 | Tragic $87,872 |
| Immigrants | Cabo Verde | 0.1 /100 | #291 | Tragic $87,830 |
| Africans | 0.1 /100 | #292 | Tragic $87,820 |
| Ute | 0.0 /100 | #293 | Tragic $87,596 |
| Fijians | 0.0 /100 | #294 | Tragic $87,387 |
| Yaqui | 0.0 /100 | #295 | Tragic $87,289 |
| Immigrants | Guatemala | 0.0 /100 | #296 | Tragic $87,191 |
| Cajuns | 0.0 /100 | #297 | Tragic $87,157 |
| Immigrants | Latin America | 0.0 /100 | #298 | Tragic $86,989 |
| Chippewa | 0.0 /100 | #299 | Tragic $86,852 |
| Ottawa | 0.0 /100 | #300 | Tragic $86,380 |
| Colville | 0.0 /100 | #301 | Tragic $85,792 |
Demographics Similar to Immigrants from Jordan by Median Family Income
In terms of median family income, the demographic groups most similar to Immigrants from Jordan are Carpatho Rusyn ($107,502, a difference of 0.20%), Pakistani ($107,390, a difference of 0.30%), European ($108,099, a difference of 0.36%), Taiwanese ($107,295, a difference of 0.39%), and Immigrants from Northern Africa ($108,161, a difference of 0.41%).
| Demographics | Rating | Rank | Median Family Income |
| Swedes | 95.1 /100 | #115 | Exceptional $108,499 |
| Chileans | 95.0 /100 | #116 | Exceptional $108,429 |
| Immigrants | Philippines | 94.6 /100 | #117 | Exceptional $108,288 |
| Ethiopians | 94.5 /100 | #118 | Exceptional $108,251 |
| Sri Lankans | 94.5 /100 | #119 | Exceptional $108,234 |
| Immigrants | Northern Africa | 94.3 /100 | #120 | Exceptional $108,161 |
| Europeans | 94.1 /100 | #121 | Exceptional $108,099 |
| Immigrants | Jordan | 92.9 /100 | #122 | Exceptional $107,715 |
| Carpatho Rusyns | 92.2 /100 | #123 | Exceptional $107,502 |
| Pakistanis | 91.7 /100 | #124 | Exceptional $107,390 |
| Taiwanese | 91.4 /100 | #125 | Exceptional $107,295 |
| Serbians | 90.8 /100 | #126 | Exceptional $107,157 |
| Lebanese | 90.5 /100 | #127 | Exceptional $107,086 |
| Immigrants | Ethiopia | 90.0 /100 | #128 | Excellent $106,969 |
| Arabs | 89.9 /100 | #129 | Excellent $106,952 |