Fijian vs New Zealander Median Family Income
COMPARE
Fijian
New Zealander
Median Family Income
Median Family Income Comparison
Fijians
New Zealanders
$87,387
MEDIAN FAMILY INCOME
0.0/ 100
METRIC RATING
294th/ 347
METRIC RANK
$115,230
MEDIAN FAMILY INCOME
99.8/ 100
METRIC RATING
56th/ 347
METRIC RANK
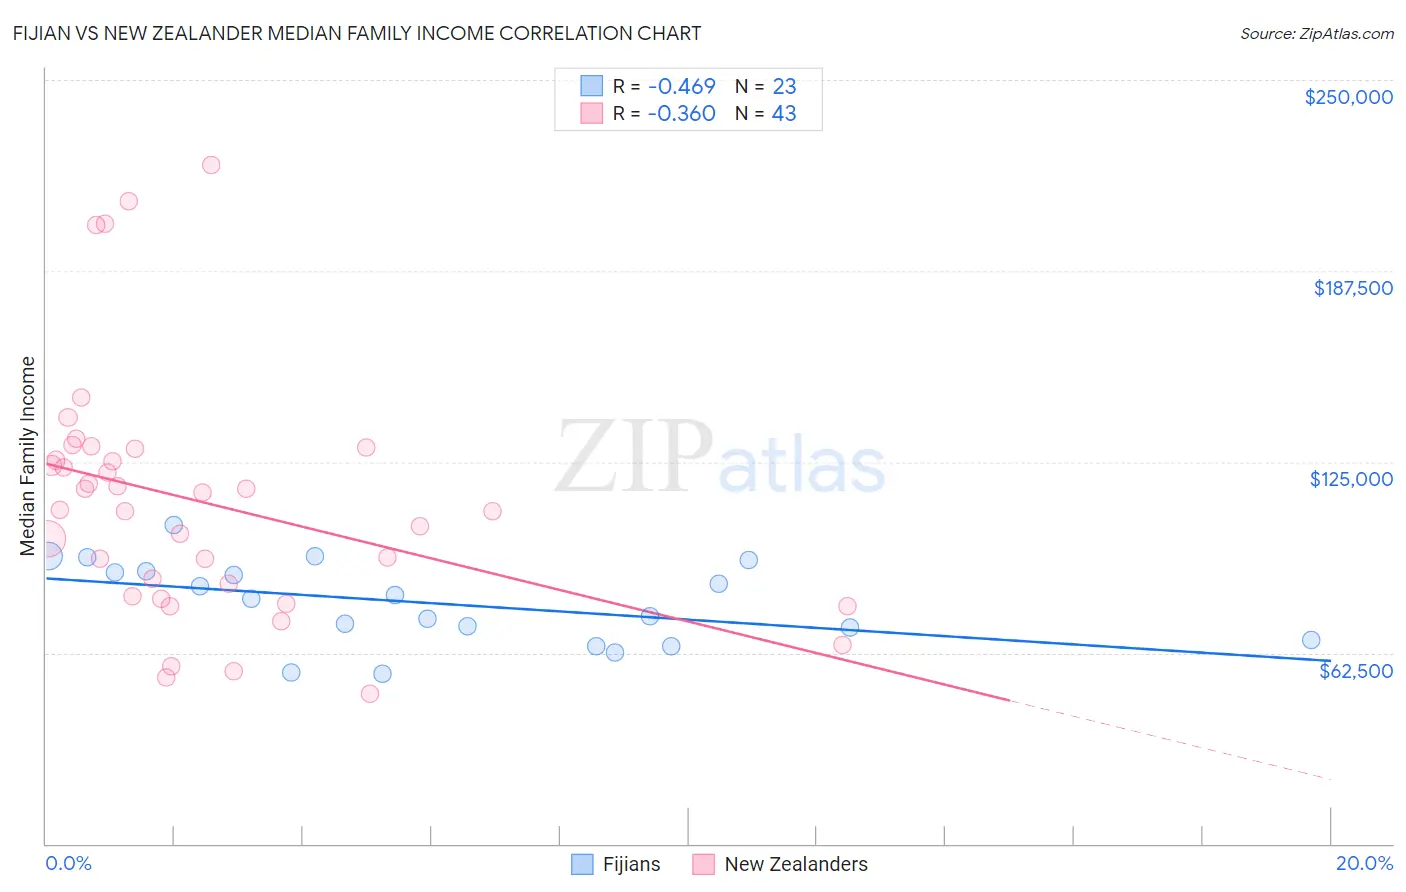
Fijian vs New Zealander Median Family Income Correlation Chart
The statistical analysis conducted on geographies consisting of 55,946,812 people shows a moderate negative correlation between the proportion of Fijians and median family income in the United States with a correlation coefficient (R) of -0.469 and weighted average of $87,387. Similarly, the statistical analysis conducted on geographies consisting of 106,887,889 people shows a mild negative correlation between the proportion of New Zealanders and median family income in the United States with a correlation coefficient (R) of -0.360 and weighted average of $115,230, a difference of 31.9%.
Median Family Income Correlation Summary
| Measurement | Fijian | New Zealander |
| Minimum | $55,821 | $49,107 |
| Maximum | $104,335 | $222,283 |
| Range | $48,514 | $173,176 |
| Mean | $78,636 | $111,963 |
| Median | $80,363 | $109,262 |
| Interquartile 25% (IQ1) | $66,750 | $80,824 |
| Interquartile 75% (IQ3) | $89,066 | $129,386 |
| Interquartile Range (IQR) | $22,316 | $48,562 |
| Standard Deviation (Sample) | $13,442 | $40,212 |
| Standard Deviation (Population) | $13,146 | $39,742 |
Similar Demographics by Median Family Income
Demographics Similar to Fijians by Median Family Income
In terms of median family income, the demographic groups most similar to Fijians are Yaqui ($87,289, a difference of 0.11%), Immigrants from Guatemala ($87,191, a difference of 0.22%), Ute ($87,596, a difference of 0.24%), Cajun ($87,157, a difference of 0.26%), and Immigrants from Latin America ($86,989, a difference of 0.46%).
| Demographics | Rating | Rank | Median Family Income |
| Potawatomi | 0.1 /100 | #287 | Tragic $88,265 |
| Cherokee | 0.1 /100 | #288 | Tragic $88,209 |
| Central American Indians | 0.1 /100 | #289 | Tragic $88,034 |
| Shoshone | 0.1 /100 | #290 | Tragic $87,872 |
| Immigrants | Cabo Verde | 0.1 /100 | #291 | Tragic $87,830 |
| Africans | 0.1 /100 | #292 | Tragic $87,820 |
| Ute | 0.0 /100 | #293 | Tragic $87,596 |
| Fijians | 0.0 /100 | #294 | Tragic $87,387 |
| Yaqui | 0.0 /100 | #295 | Tragic $87,289 |
| Immigrants | Guatemala | 0.0 /100 | #296 | Tragic $87,191 |
| Cajuns | 0.0 /100 | #297 | Tragic $87,157 |
| Immigrants | Latin America | 0.0 /100 | #298 | Tragic $86,989 |
| Chippewa | 0.0 /100 | #299 | Tragic $86,852 |
| Ottawa | 0.0 /100 | #300 | Tragic $86,380 |
| Colville | 0.0 /100 | #301 | Tragic $85,792 |
Demographics Similar to New Zealanders by Median Family Income
In terms of median family income, the demographic groups most similar to New Zealanders are Greek ($115,192, a difference of 0.030%), Immigrants from Indonesia ($115,162, a difference of 0.060%), Lithuanian ($115,395, a difference of 0.14%), Immigrants from Netherlands ($114,987, a difference of 0.21%), and Immigrants from Europe ($115,523, a difference of 0.25%).
| Demographics | Rating | Rank | Median Family Income |
| Chinese | 99.9 /100 | #49 | Exceptional $116,188 |
| Immigrants | Czechoslovakia | 99.9 /100 | #50 | Exceptional $116,165 |
| Immigrants | Malaysia | 99.9 /100 | #51 | Exceptional $115,880 |
| Maltese | 99.9 /100 | #52 | Exceptional $115,862 |
| Immigrants | Norway | 99.9 /100 | #53 | Exceptional $115,847 |
| Immigrants | Europe | 99.9 /100 | #54 | Exceptional $115,523 |
| Lithuanians | 99.8 /100 | #55 | Exceptional $115,395 |
| New Zealanders | 99.8 /100 | #56 | Exceptional $115,230 |
| Greeks | 99.8 /100 | #57 | Exceptional $115,192 |
| Immigrants | Indonesia | 99.8 /100 | #58 | Exceptional $115,162 |
| Immigrants | Netherlands | 99.8 /100 | #59 | Exceptional $114,987 |
| Immigrants | Latvia | 99.8 /100 | #60 | Exceptional $114,826 |
| Immigrants | Belarus | 99.8 /100 | #61 | Exceptional $114,586 |
| Mongolians | 99.8 /100 | #62 | Exceptional $114,553 |
| Immigrants | Pakistan | 99.8 /100 | #63 | Exceptional $114,406 |