European vs Iroquois Median Earnings
COMPARE
European
Iroquois
Median Earnings
Median Earnings Comparison
Europeans
Iroquois
$47,915
MEDIAN EARNINGS
88.9/ 100
METRIC RATING
138th/ 347
METRIC RANK
$42,430
MEDIAN EARNINGS
0.4/ 100
METRIC RATING
272nd/ 347
METRIC RANK
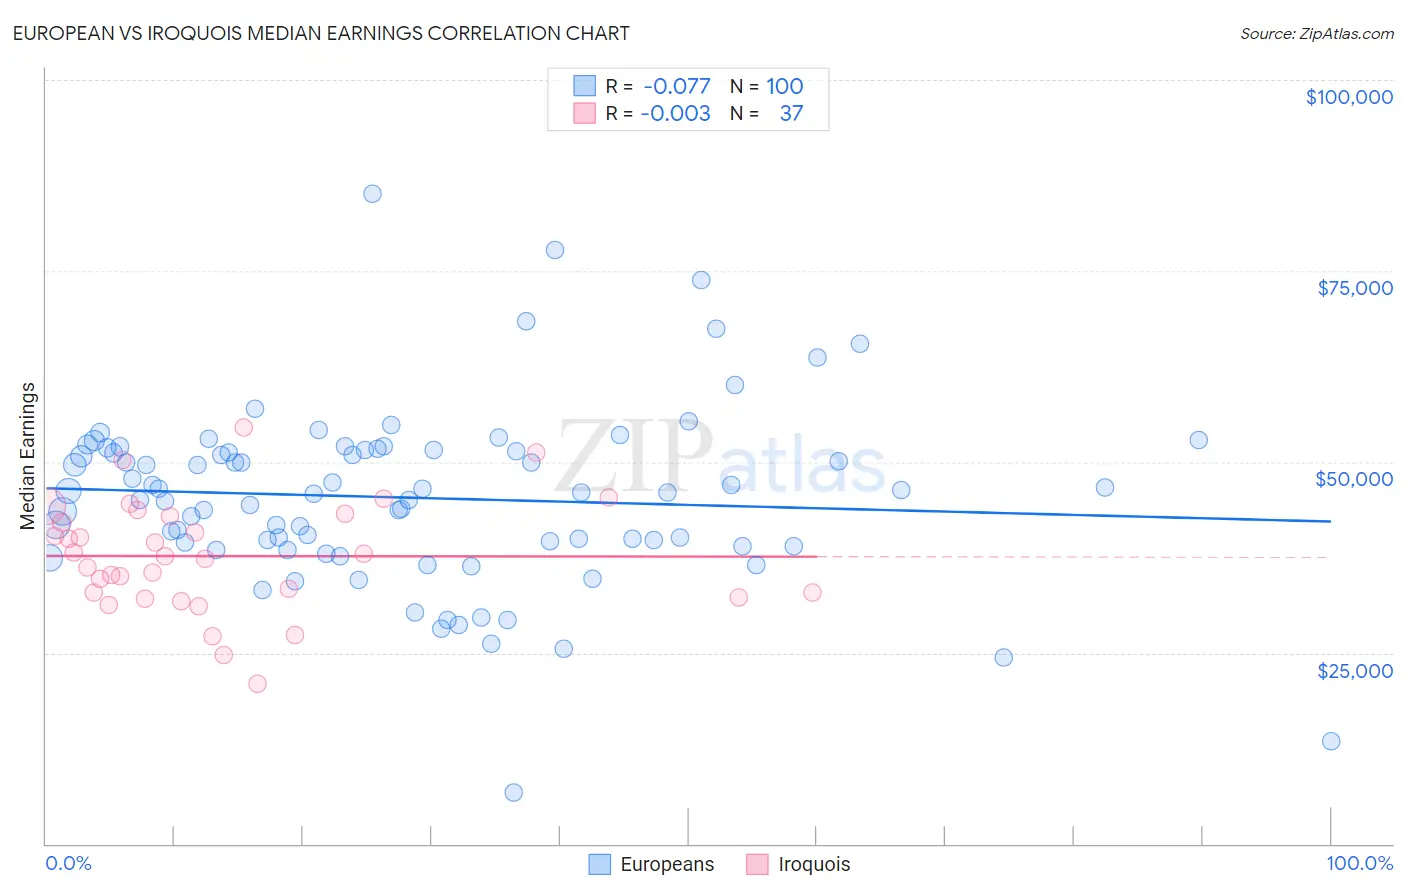
European vs Iroquois Median Earnings Correlation Chart
The statistical analysis conducted on geographies consisting of 561,558,991 people shows a slight negative correlation between the proportion of Europeans and median earnings in the United States with a correlation coefficient (R) of -0.077 and weighted average of $47,915. Similarly, the statistical analysis conducted on geographies consisting of 207,284,609 people shows no correlation between the proportion of Iroquois and median earnings in the United States with a correlation coefficient (R) of -0.003 and weighted average of $42,430, a difference of 12.9%.
Median Earnings Correlation Summary
| Measurement | European | Iroquois |
| Minimum | $6,651 | $20,893 |
| Maximum | $85,181 | $54,543 |
| Range | $78,530 | $33,650 |
| Mean | $45,294 | $37,652 |
| Median | $45,994 | $37,608 |
| Interquartile 25% (IQ1) | $39,170 | $32,548 |
| Interquartile 75% (IQ3) | $51,535 | $43,095 |
| Interquartile Range (IQR) | $12,364 | $10,547 |
| Standard Deviation (Sample) | $11,738 | $7,302 |
| Standard Deviation (Population) | $11,679 | $7,203 |
Similar Demographics by Median Earnings
Demographics Similar to Europeans by Median Earnings
In terms of median earnings, the demographic groups most similar to Europeans are Canadian ($47,911, a difference of 0.010%), Immigrants from Nepal ($47,925, a difference of 0.020%), Taiwanese ($47,902, a difference of 0.030%), Immigrants from Sierra Leone ($47,875, a difference of 0.080%), and Ugandan ($47,854, a difference of 0.13%).
| Demographics | Rating | Rank | Median Earnings |
| Lebanese | 92.5 /100 | #131 | Exceptional $48,226 |
| British | 92.2 /100 | #132 | Exceptional $48,189 |
| Immigrants | Uganda | 90.5 /100 | #133 | Exceptional $48,041 |
| Sri Lankans | 90.5 /100 | #134 | Exceptional $48,040 |
| Portuguese | 90.4 /100 | #135 | Exceptional $48,032 |
| Slovenes | 90.0 /100 | #136 | Excellent $47,995 |
| Immigrants | Nepal | 89.0 /100 | #137 | Excellent $47,925 |
| Europeans | 88.9 /100 | #138 | Excellent $47,915 |
| Canadians | 88.8 /100 | #139 | Excellent $47,911 |
| Taiwanese | 88.7 /100 | #140 | Excellent $47,902 |
| Immigrants | Sierra Leone | 88.3 /100 | #141 | Excellent $47,875 |
| Ugandans | 88.0 /100 | #142 | Excellent $47,854 |
| Swedes | 88.0 /100 | #143 | Excellent $47,851 |
| Hungarians | 87.1 /100 | #144 | Excellent $47,795 |
| Immigrants | Saudi Arabia | 85.6 /100 | #145 | Excellent $47,704 |
Demographics Similar to Iroquois by Median Earnings
In terms of median earnings, the demographic groups most similar to Iroquois are Immigrants from Dominica ($42,420, a difference of 0.030%), Immigrants from El Salvador ($42,413, a difference of 0.040%), Immigrants from Belize ($42,339, a difference of 0.22%), Spanish American ($42,316, a difference of 0.27%), and Central American ($42,280, a difference of 0.36%).
| Demographics | Rating | Rank | Median Earnings |
| Salvadorans | 0.7 /100 | #265 | Tragic $42,912 |
| Immigrants | Laos | 0.7 /100 | #266 | Tragic $42,884 |
| Cree | 0.6 /100 | #267 | Tragic $42,777 |
| Americans | 0.6 /100 | #268 | Tragic $42,742 |
| Belizeans | 0.5 /100 | #269 | Tragic $42,702 |
| Osage | 0.5 /100 | #270 | Tragic $42,651 |
| Pennsylvania Germans | 0.5 /100 | #271 | Tragic $42,615 |
| Iroquois | 0.4 /100 | #272 | Tragic $42,430 |
| Immigrants | Dominica | 0.4 /100 | #273 | Tragic $42,420 |
| Immigrants | El Salvador | 0.4 /100 | #274 | Tragic $42,413 |
| Immigrants | Belize | 0.3 /100 | #275 | Tragic $42,339 |
| Spanish Americans | 0.3 /100 | #276 | Tragic $42,316 |
| Central Americans | 0.3 /100 | #277 | Tragic $42,280 |
| Cajuns | 0.3 /100 | #278 | Tragic $42,189 |
| Colville | 0.2 /100 | #279 | Tragic $42,151 |