Ethiopian vs Immigrants from Caribbean Unemployment Among Ages 65 to 74 years
COMPARE
Ethiopian
Immigrants from Caribbean
Unemployment Among Ages 65 to 74 years
Unemployment Among Ages 65 to 74 years Comparison
Ethiopians
Immigrants from Caribbean
5.0%
UNEMPLOYMENT AMONG AGES 65 TO 74 YEARS
100.0/ 100
METRIC RATING
29th/ 347
METRIC RANK
5.5%
UNEMPLOYMENT AMONG AGES 65 TO 74 YEARS
2.7/ 100
METRIC RATING
230th/ 347
METRIC RANK
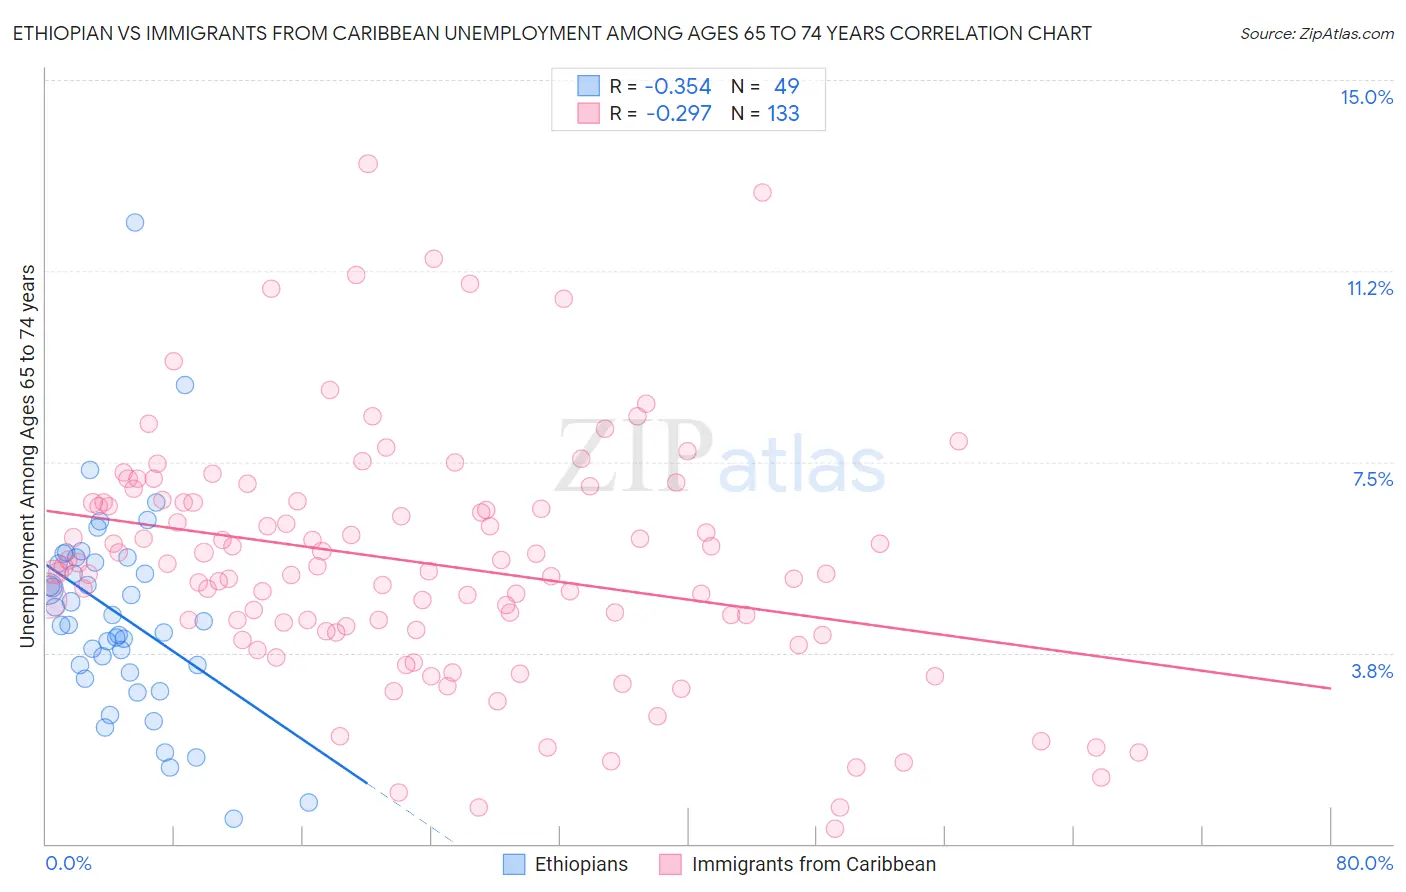
Ethiopian vs Immigrants from Caribbean Unemployment Among Ages 65 to 74 years Correlation Chart
The statistical analysis conducted on geographies consisting of 206,778,623 people shows a mild negative correlation between the proportion of Ethiopians and unemployment rate among population between the ages 65 and 74 in the United States with a correlation coefficient (R) of -0.354 and weighted average of 5.0%. Similarly, the statistical analysis conducted on geographies consisting of 388,435,065 people shows a weak negative correlation between the proportion of Immigrants from Caribbean and unemployment rate among population between the ages 65 and 74 in the United States with a correlation coefficient (R) of -0.297 and weighted average of 5.5%, a difference of 10.7%.
Unemployment Among Ages 65 to 74 years Correlation Summary
| Measurement | Ethiopian | Immigrants from Caribbean |
| Minimum | 0.50% | 0.30% |
| Maximum | 12.2% | 13.4% |
| Range | 11.7% | 13.1% |
| Mean | 4.5% | 5.5% |
| Median | 4.4% | 5.4% |
| Interquartile 25% (IQ1) | 3.4% | 4.2% |
| Interquartile 75% (IQ3) | 5.6% | 6.7% |
| Interquartile Range (IQR) | 2.1% | 2.5% |
| Standard Deviation (Sample) | 2.0% | 2.4% |
| Standard Deviation (Population) | 2.0% | 2.4% |
Similar Demographics by Unemployment Among Ages 65 to 74 years
Demographics Similar to Ethiopians by Unemployment Among Ages 65 to 74 years
In terms of unemployment among ages 65 to 74 years, the demographic groups most similar to Ethiopians are Immigrants from Lebanon (5.0%, a difference of 0.090%), Slovene (5.0%, a difference of 0.19%), Bulgarian (5.0%, a difference of 0.45%), Palestinian (5.0%, a difference of 0.47%), and Belgian (5.0%, a difference of 0.52%).
| Demographics | Rating | Rank | Unemployment Among Ages 65 to 74 years |
| Lebanese | 100.0 /100 | #22 | Exceptional 4.9% |
| Immigrants | Nepal | 100.0 /100 | #23 | Exceptional 4.9% |
| Iraqis | 100.0 /100 | #24 | Exceptional 4.9% |
| Macedonians | 100.0 /100 | #25 | Exceptional 5.0% |
| Czechs | 100.0 /100 | #26 | Exceptional 5.0% |
| Norwegians | 100.0 /100 | #27 | Exceptional 5.0% |
| Bulgarians | 100.0 /100 | #28 | Exceptional 5.0% |
| Ethiopians | 100.0 /100 | #29 | Exceptional 5.0% |
| Immigrants | Lebanon | 100.0 /100 | #30 | Exceptional 5.0% |
| Slovenes | 100.0 /100 | #31 | Exceptional 5.0% |
| Palestinians | 100.0 /100 | #32 | Exceptional 5.0% |
| Belgians | 100.0 /100 | #33 | Exceptional 5.0% |
| Cambodians | 100.0 /100 | #34 | Exceptional 5.0% |
| Bhutanese | 100.0 /100 | #35 | Exceptional 5.0% |
| Immigrants | Kuwait | 99.9 /100 | #36 | Exceptional 5.0% |
Demographics Similar to Immigrants from Caribbean by Unemployment Among Ages 65 to 74 years
In terms of unemployment among ages 65 to 74 years, the demographic groups most similar to Immigrants from Caribbean are West Indian (5.5%, a difference of 0.020%), Israeli (5.5%, a difference of 0.040%), Nigerian (5.5%, a difference of 0.050%), Immigrants from Israel (5.5%, a difference of 0.10%), and South American Indian (5.5%, a difference of 0.14%).
| Demographics | Rating | Rank | Unemployment Among Ages 65 to 74 years |
| Hungarians | 4.4 /100 | #223 | Tragic 5.5% |
| Immigrants | Uruguay | 4.2 /100 | #224 | Tragic 5.5% |
| Immigrants | Trinidad and Tobago | 4.1 /100 | #225 | Tragic 5.5% |
| Hondurans | 3.7 /100 | #226 | Tragic 5.5% |
| Immigrants | Albania | 3.7 /100 | #227 | Tragic 5.5% |
| Immigrants | Israel | 3.0 /100 | #228 | Tragic 5.5% |
| West Indians | 2.7 /100 | #229 | Tragic 5.5% |
| Immigrants | Caribbean | 2.7 /100 | #230 | Tragic 5.5% |
| Israelis | 2.5 /100 | #231 | Tragic 5.5% |
| Nigerians | 2.5 /100 | #232 | Tragic 5.5% |
| South American Indians | 2.3 /100 | #233 | Tragic 5.5% |
| French American Indians | 2.2 /100 | #234 | Tragic 5.5% |
| Peruvians | 2.2 /100 | #235 | Tragic 5.5% |
| Hopi | 2.2 /100 | #236 | Tragic 5.5% |
| Immigrants | Belize | 2.2 /100 | #237 | Tragic 5.5% |