Immigrants from Fiji vs Cypriot Median Household Income
COMPARE
Immigrants from Fiji
Cypriot
Median Household Income
Median Household Income Comparison
Immigrants from Fiji
Cypriots
$93,933
MEDIAN HOUSEHOLD INCOME
99.7/ 100
METRIC RATING
70th/ 347
METRIC RANK
$102,843
MEDIAN HOUSEHOLD INCOME
100.0/ 100
METRIC RATING
18th/ 347
METRIC RANK
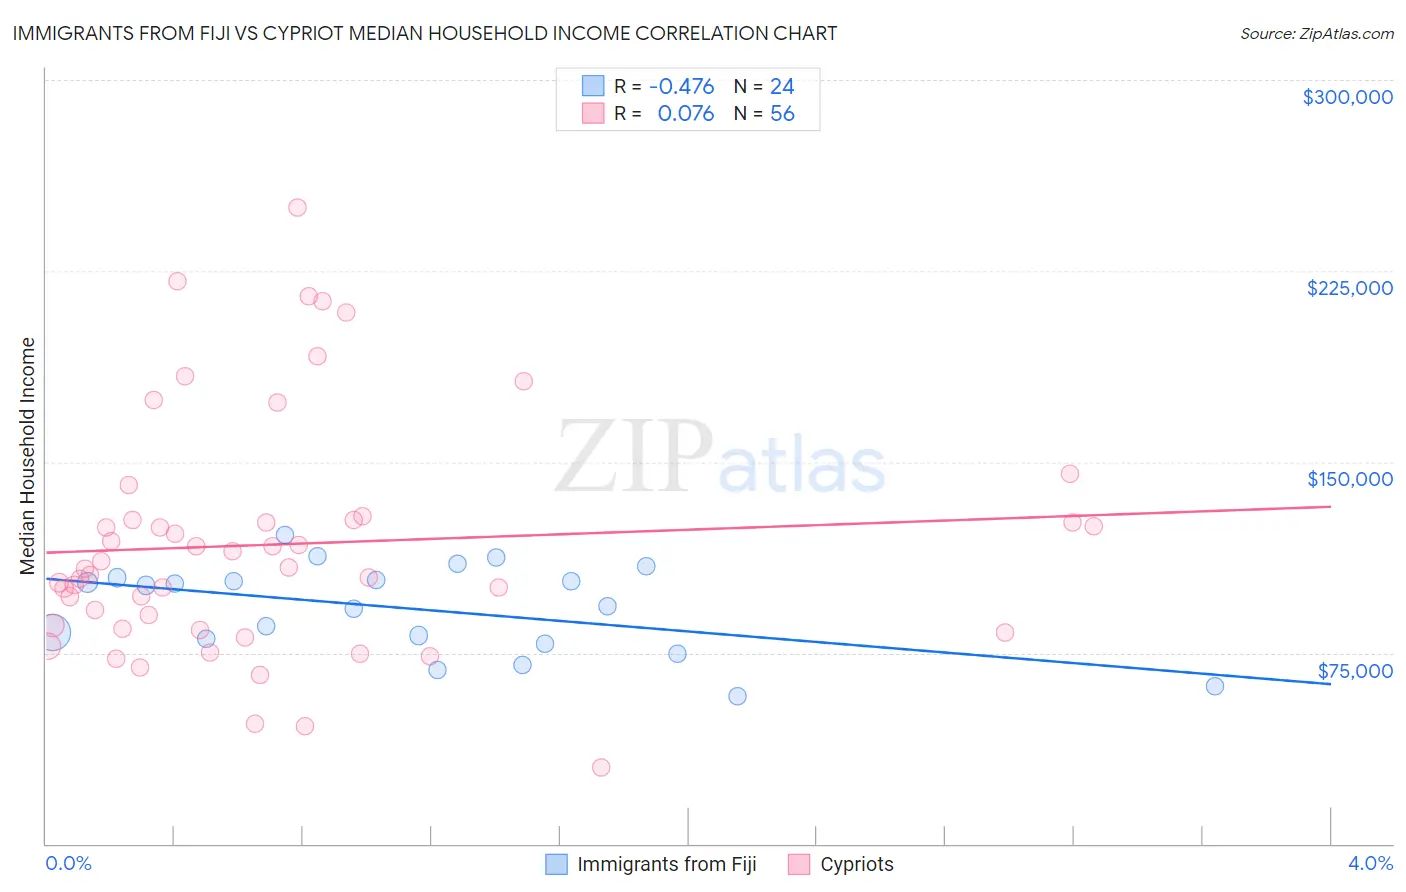
Immigrants from Fiji vs Cypriot Median Household Income Correlation Chart
The statistical analysis conducted on geographies consisting of 93,754,169 people shows a moderate negative correlation between the proportion of Immigrants from Fiji and median household income in the United States with a correlation coefficient (R) of -0.476 and weighted average of $93,933. Similarly, the statistical analysis conducted on geographies consisting of 61,845,026 people shows a slight positive correlation between the proportion of Cypriots and median household income in the United States with a correlation coefficient (R) of 0.076 and weighted average of $102,843, a difference of 9.5%.
Median Household Income Correlation Summary
| Measurement | Immigrants from Fiji | Cypriot |
| Minimum | $58,122 | $30,029 |
| Maximum | $121,408 | $250,001 |
| Range | $63,286 | $219,972 |
| Mean | $92,206 | $117,612 |
| Median | $97,285 | $108,270 |
| Interquartile 25% (IQ1) | $79,580 | $84,969 |
| Interquartile 75% (IQ3) | $103,956 | $127,095 |
| Interquartile Range (IQR) | $24,377 | $42,126 |
| Standard Deviation (Sample) | $17,579 | $46,602 |
| Standard Deviation (Population) | $17,209 | $46,184 |
Similar Demographics by Median Household Income
Demographics Similar to Immigrants from Fiji by Median Household Income
In terms of median household income, the demographic groups most similar to Immigrants from Fiji are Argentinean ($93,960, a difference of 0.030%), Mongolian ($93,971, a difference of 0.040%), Immigrants from Philippines ($93,899, a difference of 0.040%), Lithuanian ($93,852, a difference of 0.090%), and Immigrants from Scotland ($94,091, a difference of 0.17%).
| Demographics | Rating | Rank | Median Household Income |
| Greeks | 99.8 /100 | #63 | Exceptional $94,735 |
| Immigrants | Netherlands | 99.7 /100 | #64 | Exceptional $94,411 |
| Immigrants | Belarus | 99.7 /100 | #65 | Exceptional $94,399 |
| Immigrants | Romania | 99.7 /100 | #66 | Exceptional $94,222 |
| Immigrants | Scotland | 99.7 /100 | #67 | Exceptional $94,091 |
| Mongolians | 99.7 /100 | #68 | Exceptional $93,971 |
| Argentineans | 99.7 /100 | #69 | Exceptional $93,960 |
| Immigrants | Fiji | 99.7 /100 | #70 | Exceptional $93,933 |
| Immigrants | Philippines | 99.6 /100 | #71 | Exceptional $93,899 |
| Lithuanians | 99.6 /100 | #72 | Exceptional $93,852 |
| Immigrants | Egypt | 99.6 /100 | #73 | Exceptional $93,700 |
| Immigrants | Latvia | 99.6 /100 | #74 | Exceptional $93,602 |
| Immigrants | Italy | 99.5 /100 | #75 | Exceptional $93,465 |
| South Africans | 99.5 /100 | #76 | Exceptional $93,379 |
| Immigrants | Afghanistan | 99.5 /100 | #77 | Exceptional $93,375 |
Demographics Similar to Cypriots by Median Household Income
In terms of median household income, the demographic groups most similar to Cypriots are Immigrants from Korea ($102,962, a difference of 0.12%), Immigrants from Australia ($102,562, a difference of 0.27%), Burmese ($103,145, a difference of 0.29%), Bolivian ($102,195, a difference of 0.63%), and Eastern European ($101,781, a difference of 1.0%).
| Demographics | Rating | Rank | Median Household Income |
| Immigrants | China | 100.0 /100 | #11 | Exceptional $105,335 |
| Indians (Asian) | 100.0 /100 | #12 | Exceptional $105,262 |
| Immigrants | Eastern Asia | 100.0 /100 | #13 | Exceptional $104,796 |
| Immigrants | Ireland | 100.0 /100 | #14 | Exceptional $104,692 |
| Immigrants | Israel | 100.0 /100 | #15 | Exceptional $104,090 |
| Burmese | 100.0 /100 | #16 | Exceptional $103,145 |
| Immigrants | Korea | 100.0 /100 | #17 | Exceptional $102,962 |
| Cypriots | 100.0 /100 | #18 | Exceptional $102,843 |
| Immigrants | Australia | 100.0 /100 | #19 | Exceptional $102,562 |
| Bolivians | 100.0 /100 | #20 | Exceptional $102,195 |
| Eastern Europeans | 100.0 /100 | #21 | Exceptional $101,781 |
| Asians | 100.0 /100 | #22 | Exceptional $101,681 |
| Immigrants | Bolivia | 100.0 /100 | #23 | Exceptional $101,394 |
| Immigrants | Japan | 100.0 /100 | #24 | Exceptional $100,711 |
| Immigrants | Sweden | 100.0 /100 | #25 | Exceptional $100,699 |