Estonian vs Soviet Union Median Male Earnings
COMPARE
Estonian
Soviet Union
Median Male Earnings
Median Male Earnings Comparison
Estonians
Soviet Union
$61,710
MEDIAN MALE EARNINGS
99.9/ 100
METRIC RATING
51st/ 347
METRIC RANK
$63,382
MEDIAN MALE EARNINGS
100.0/ 100
METRIC RATING
32nd/ 347
METRIC RANK
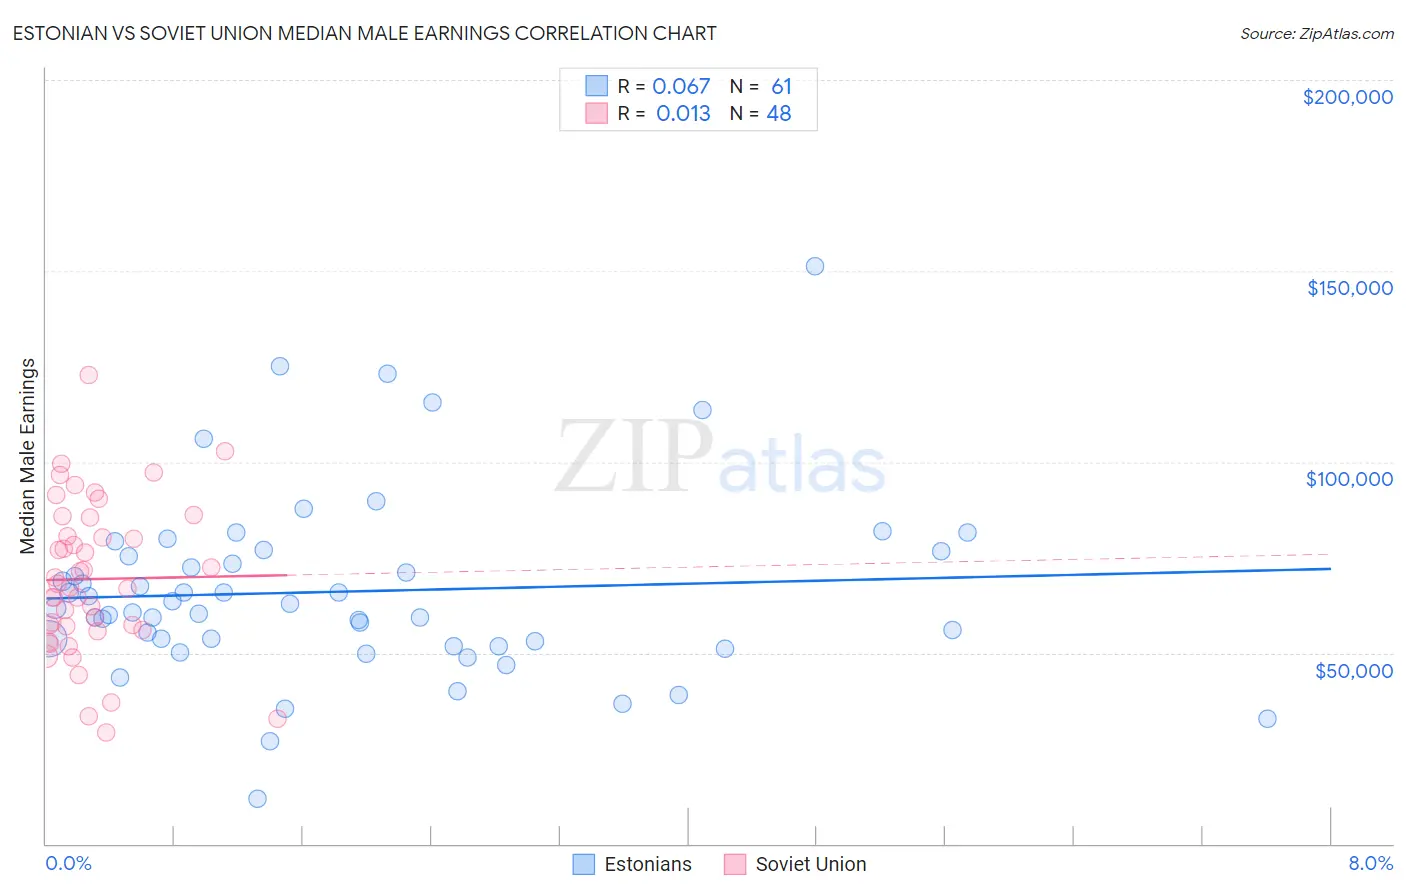
Estonian vs Soviet Union Median Male Earnings Correlation Chart
The statistical analysis conducted on geographies consisting of 123,512,238 people shows a slight positive correlation between the proportion of Estonians and median male earnings in the United States with a correlation coefficient (R) of 0.067 and weighted average of $61,710. Similarly, the statistical analysis conducted on geographies consisting of 43,507,869 people shows no correlation between the proportion of Soviet Union and median male earnings in the United States with a correlation coefficient (R) of 0.013 and weighted average of $63,382, a difference of 2.7%.
Median Male Earnings Correlation Summary
| Measurement | Estonian | Soviet Union |
| Minimum | $11,700 | $29,197 |
| Maximum | $151,311 | $122,813 |
| Range | $139,611 | $93,616 |
| Mean | $66,018 | $69,321 |
| Median | $61,673 | $67,564 |
| Interquartile 25% (IQ1) | $52,472 | $56,498 |
| Interquartile 75% (IQ3) | $76,012 | $82,953 |
| Interquartile Range (IQR) | $23,541 | $26,455 |
| Standard Deviation (Sample) | $24,287 | $19,957 |
| Standard Deviation (Population) | $24,087 | $19,748 |
Demographics Similar to Estonians and Soviet Union by Median Male Earnings
In terms of median male earnings, the demographic groups most similar to Estonians are Bhutanese ($61,759, a difference of 0.080%), Immigrants from Europe ($62,057, a difference of 0.56%), Immigrants from Malaysia ($62,121, a difference of 0.67%), Immigrants from Austria ($62,164, a difference of 0.74%), and Immigrants from Czechoslovakia ($62,217, a difference of 0.82%). Similarly, the demographic groups most similar to Soviet Union are Immigrants from Lithuania ($63,346, a difference of 0.060%), Immigrants from Russia ($63,326, a difference of 0.090%), Latvian ($63,498, a difference of 0.18%), Immigrants from Asia ($63,240, a difference of 0.22%), and Israeli ($63,228, a difference of 0.24%).
| Demographics | Rating | Rank | Median Male Earnings |
| Latvians | 100.0 /100 | #31 | Exceptional $63,498 |
| Soviet Union | 100.0 /100 | #32 | Exceptional $63,382 |
| Immigrants | Lithuania | 100.0 /100 | #33 | Exceptional $63,346 |
| Immigrants | Russia | 100.0 /100 | #34 | Exceptional $63,326 |
| Immigrants | Asia | 100.0 /100 | #35 | Exceptional $63,240 |
| Israelis | 100.0 /100 | #36 | Exceptional $63,228 |
| Immigrants | Sri Lanka | 100.0 /100 | #37 | Exceptional $63,099 |
| Maltese | 100.0 /100 | #38 | Exceptional $62,953 |
| Immigrants | South Africa | 100.0 /100 | #39 | Exceptional $62,899 |
| Australians | 100.0 /100 | #40 | Exceptional $62,857 |
| Immigrants | Turkey | 100.0 /100 | #41 | Exceptional $62,728 |
| Immigrants | Greece | 100.0 /100 | #42 | Exceptional $62,689 |
| Immigrants | Belarus | 100.0 /100 | #43 | Exceptional $62,658 |
| Cambodians | 100.0 /100 | #44 | Exceptional $62,516 |
| Bulgarians | 100.0 /100 | #45 | Exceptional $62,378 |
| Immigrants | Czechoslovakia | 99.9 /100 | #46 | Exceptional $62,217 |
| Immigrants | Austria | 99.9 /100 | #47 | Exceptional $62,164 |
| Immigrants | Malaysia | 99.9 /100 | #48 | Exceptional $62,121 |
| Immigrants | Europe | 99.9 /100 | #49 | Exceptional $62,057 |
| Bhutanese | 99.9 /100 | #50 | Exceptional $61,759 |
| Estonians | 99.9 /100 | #51 | Exceptional $61,710 |