Estonian vs European Median Male Earnings
COMPARE
Estonian
European
Median Male Earnings
Median Male Earnings Comparison
Estonians
Europeans
$61,710
MEDIAN MALE EARNINGS
99.9/ 100
METRIC RATING
51st/ 347
METRIC RANK
$57,637
MEDIAN MALE EARNINGS
95.6/ 100
METRIC RATING
111th/ 347
METRIC RANK
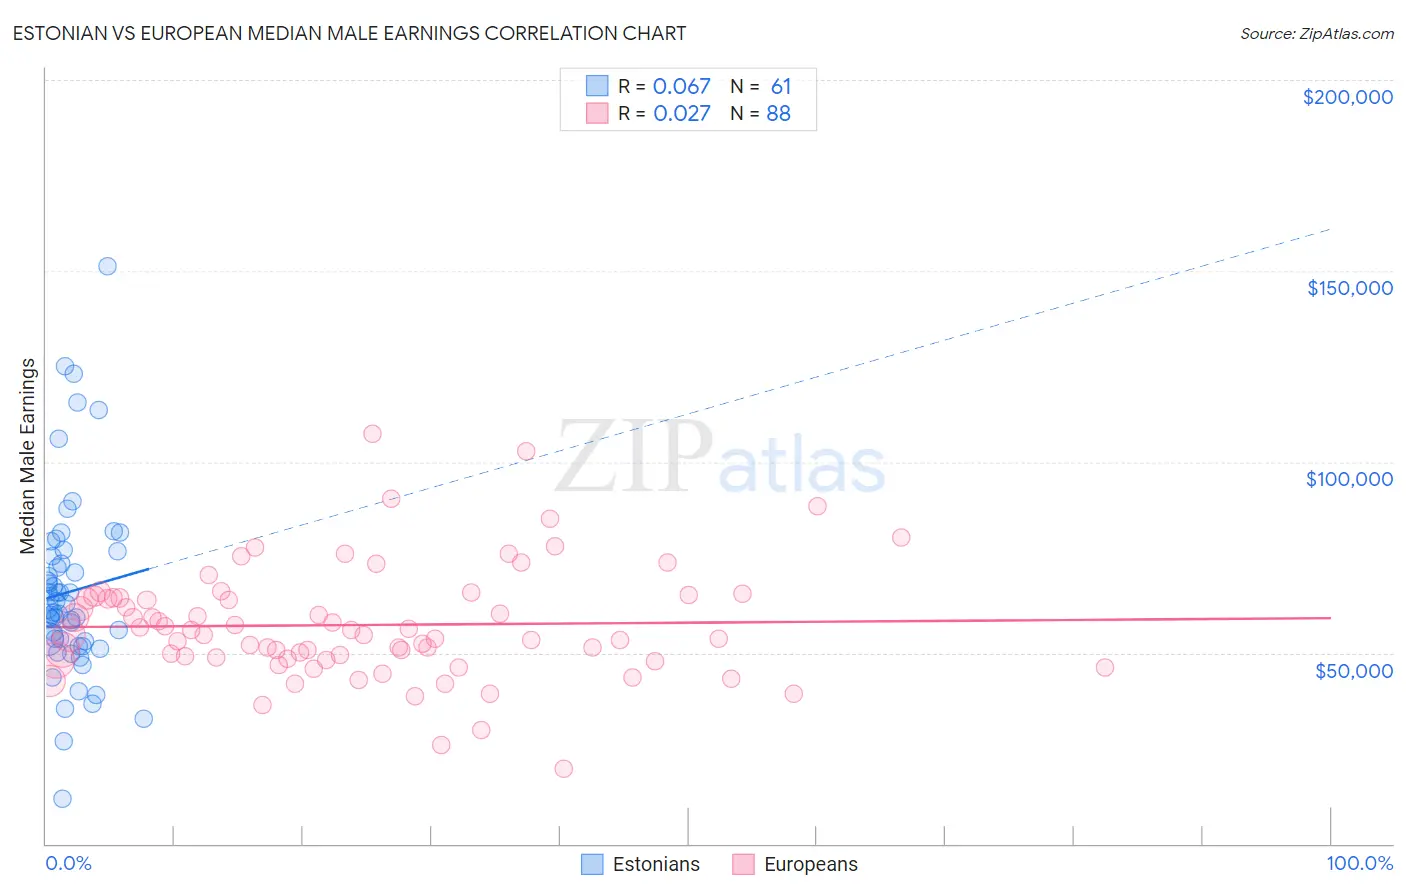
Estonian vs European Median Male Earnings Correlation Chart
The statistical analysis conducted on geographies consisting of 123,512,238 people shows a slight positive correlation between the proportion of Estonians and median male earnings in the United States with a correlation coefficient (R) of 0.067 and weighted average of $61,710. Similarly, the statistical analysis conducted on geographies consisting of 560,846,229 people shows no correlation between the proportion of Europeans and median male earnings in the United States with a correlation coefficient (R) of 0.027 and weighted average of $57,637, a difference of 7.1%.
Median Male Earnings Correlation Summary
| Measurement | Estonian | European |
| Minimum | $11,700 | $19,583 |
| Maximum | $151,311 | $107,377 |
| Range | $139,611 | $87,794 |
| Mean | $66,018 | $57,294 |
| Median | $61,673 | $54,588 |
| Interquartile 25% (IQ1) | $52,472 | $48,703 |
| Interquartile 75% (IQ3) | $76,012 | $64,440 |
| Interquartile Range (IQR) | $23,541 | $15,737 |
| Standard Deviation (Sample) | $24,287 | $14,840 |
| Standard Deviation (Population) | $24,087 | $14,755 |
Similar Demographics by Median Male Earnings
Demographics Similar to Estonians by Median Male Earnings
In terms of median male earnings, the demographic groups most similar to Estonians are Bhutanese ($61,759, a difference of 0.080%), Immigrants from Norway ($61,628, a difference of 0.13%), South African ($61,460, a difference of 0.41%), Immigrants from Latvia ($61,422, a difference of 0.47%), and Immigrants from Europe ($62,057, a difference of 0.56%).
| Demographics | Rating | Rank | Median Male Earnings |
| Cambodians | 100.0 /100 | #44 | Exceptional $62,516 |
| Bulgarians | 100.0 /100 | #45 | Exceptional $62,378 |
| Immigrants | Czechoslovakia | 99.9 /100 | #46 | Exceptional $62,217 |
| Immigrants | Austria | 99.9 /100 | #47 | Exceptional $62,164 |
| Immigrants | Malaysia | 99.9 /100 | #48 | Exceptional $62,121 |
| Immigrants | Europe | 99.9 /100 | #49 | Exceptional $62,057 |
| Bhutanese | 99.9 /100 | #50 | Exceptional $61,759 |
| Estonians | 99.9 /100 | #51 | Exceptional $61,710 |
| Immigrants | Norway | 99.9 /100 | #52 | Exceptional $61,628 |
| South Africans | 99.9 /100 | #53 | Exceptional $61,460 |
| Immigrants | Latvia | 99.9 /100 | #54 | Exceptional $61,422 |
| Greeks | 99.9 /100 | #55 | Exceptional $61,242 |
| Lithuanians | 99.9 /100 | #56 | Exceptional $61,228 |
| Immigrants | Scotland | 99.9 /100 | #57 | Exceptional $61,220 |
| New Zealanders | 99.9 /100 | #58 | Exceptional $61,199 |
Demographics Similar to Europeans by Median Male Earnings
In terms of median male earnings, the demographic groups most similar to Europeans are Immigrants from Afghanistan ($57,582, a difference of 0.090%), Carpatho Rusyn ($57,572, a difference of 0.11%), Immigrants from Kuwait ($57,562, a difference of 0.13%), Palestinian ($57,778, a difference of 0.25%), and Swedish ($57,445, a difference of 0.33%).
| Demographics | Rating | Rank | Median Male Earnings |
| Armenians | 97.3 /100 | #104 | Exceptional $58,134 |
| Immigrants | Western Asia | 97.3 /100 | #105 | Exceptional $58,131 |
| Immigrants | Northern Africa | 96.9 /100 | #106 | Exceptional $58,008 |
| Serbians | 96.8 /100 | #107 | Exceptional $57,975 |
| Immigrants | Uzbekistan | 96.7 /100 | #108 | Exceptional $57,941 |
| British | 96.5 /100 | #109 | Exceptional $57,890 |
| Palestinians | 96.2 /100 | #110 | Exceptional $57,778 |
| Europeans | 95.6 /100 | #111 | Exceptional $57,637 |
| Immigrants | Afghanistan | 95.4 /100 | #112 | Exceptional $57,582 |
| Carpatho Rusyns | 95.3 /100 | #113 | Exceptional $57,572 |
| Immigrants | Kuwait | 95.3 /100 | #114 | Exceptional $57,562 |
| Swedes | 94.8 /100 | #115 | Exceptional $57,445 |
| Lebanese | 94.6 /100 | #116 | Exceptional $57,409 |
| Immigrants | Zimbabwe | 94.3 /100 | #117 | Exceptional $57,352 |
| Hungarians | 94.0 /100 | #118 | Exceptional $57,309 |