Eastern European vs Soviet Union Median Male Earnings
COMPARE
Eastern European
Soviet Union
Median Male Earnings
Median Male Earnings Comparison
Eastern Europeans
Soviet Union
$66,472
MEDIAN MALE EARNINGS
100.0/ 100
METRIC RATING
16th/ 347
METRIC RANK
$63,382
MEDIAN MALE EARNINGS
100.0/ 100
METRIC RATING
32nd/ 347
METRIC RANK
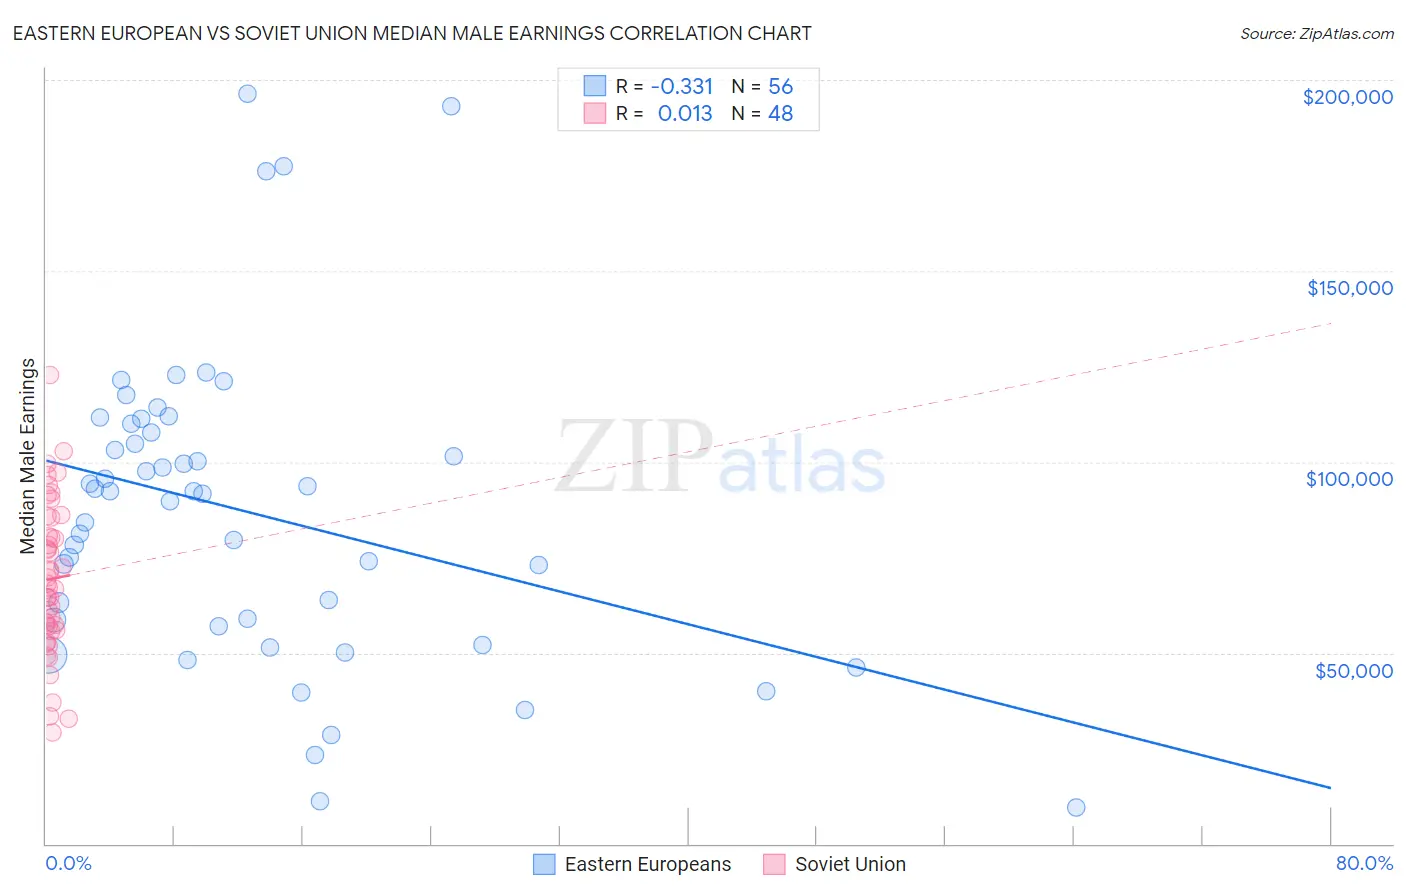
Eastern European vs Soviet Union Median Male Earnings Correlation Chart
The statistical analysis conducted on geographies consisting of 460,960,346 people shows a mild negative correlation between the proportion of Eastern Europeans and median male earnings in the United States with a correlation coefficient (R) of -0.331 and weighted average of $66,472. Similarly, the statistical analysis conducted on geographies consisting of 43,507,869 people shows no correlation between the proportion of Soviet Union and median male earnings in the United States with a correlation coefficient (R) of 0.013 and weighted average of $63,382, a difference of 4.9%.
Median Male Earnings Correlation Summary
| Measurement | Eastern European | Soviet Union |
| Minimum | $9,364 | $29,197 |
| Maximum | $196,250 | $122,813 |
| Range | $186,886 | $93,616 |
| Mean | $86,901 | $69,321 |
| Median | $91,970 | $67,564 |
| Interquartile 25% (IQ1) | $57,711 | $56,498 |
| Interquartile 75% (IQ3) | $108,812 | $82,953 |
| Interquartile Range (IQR) | $51,101 | $26,455 |
| Standard Deviation (Sample) | $40,387 | $19,957 |
| Standard Deviation (Population) | $40,024 | $19,748 |
Demographics Similar to Eastern Europeans and Soviet Union by Median Male Earnings
In terms of median male earnings, the demographic groups most similar to Eastern Europeans are Immigrants from Belgium ($66,125, a difference of 0.53%), Indian (Asian) ($66,078, a difference of 0.60%), Immigrants from Eastern Asia ($66,903, a difference of 0.65%), Okinawan ($67,232, a difference of 1.1%), and Cypriot ($65,549, a difference of 1.4%). Similarly, the demographic groups most similar to Soviet Union are Immigrants from Lithuania ($63,346, a difference of 0.060%), Immigrants from Russia ($63,326, a difference of 0.090%), Latvian ($63,498, a difference of 0.18%), Immigrants from France ($63,715, a difference of 0.53%), and Asian ($63,827, a difference of 0.70%).
| Demographics | Rating | Rank | Median Male Earnings |
| Okinawans | 100.0 /100 | #14 | Exceptional $67,232 |
| Immigrants | Eastern Asia | 100.0 /100 | #15 | Exceptional $66,903 |
| Eastern Europeans | 100.0 /100 | #16 | Exceptional $66,472 |
| Immigrants | Belgium | 100.0 /100 | #17 | Exceptional $66,125 |
| Indians (Asian) | 100.0 /100 | #18 | Exceptional $66,078 |
| Cypriots | 100.0 /100 | #19 | Exceptional $65,549 |
| Immigrants | Japan | 100.0 /100 | #20 | Exceptional $65,518 |
| Immigrants | Sweden | 100.0 /100 | #21 | Exceptional $65,406 |
| Burmese | 100.0 /100 | #22 | Exceptional $65,236 |
| Immigrants | Korea | 100.0 /100 | #23 | Exceptional $65,079 |
| Immigrants | Northern Europe | 100.0 /100 | #24 | Exceptional $64,987 |
| Immigrants | Denmark | 100.0 /100 | #25 | Exceptional $64,625 |
| Turks | 100.0 /100 | #26 | Exceptional $64,253 |
| Immigrants | Switzerland | 100.0 /100 | #27 | Exceptional $63,944 |
| Russians | 100.0 /100 | #28 | Exceptional $63,939 |
| Asians | 100.0 /100 | #29 | Exceptional $63,827 |
| Immigrants | France | 100.0 /100 | #30 | Exceptional $63,715 |
| Latvians | 100.0 /100 | #31 | Exceptional $63,498 |
| Soviet Union | 100.0 /100 | #32 | Exceptional $63,382 |
| Immigrants | Lithuania | 100.0 /100 | #33 | Exceptional $63,346 |
| Immigrants | Russia | 100.0 /100 | #34 | Exceptional $63,326 |