Estonian vs Immigrants from Ireland Median Male Earnings
COMPARE
Estonian
Immigrants from Ireland
Median Male Earnings
Median Male Earnings Comparison
Estonians
Immigrants from Ireland
$61,710
MEDIAN MALE EARNINGS
99.9/ 100
METRIC RATING
51st/ 347
METRIC RANK
$67,698
MEDIAN MALE EARNINGS
100.0/ 100
METRIC RATING
11th/ 347
METRIC RANK
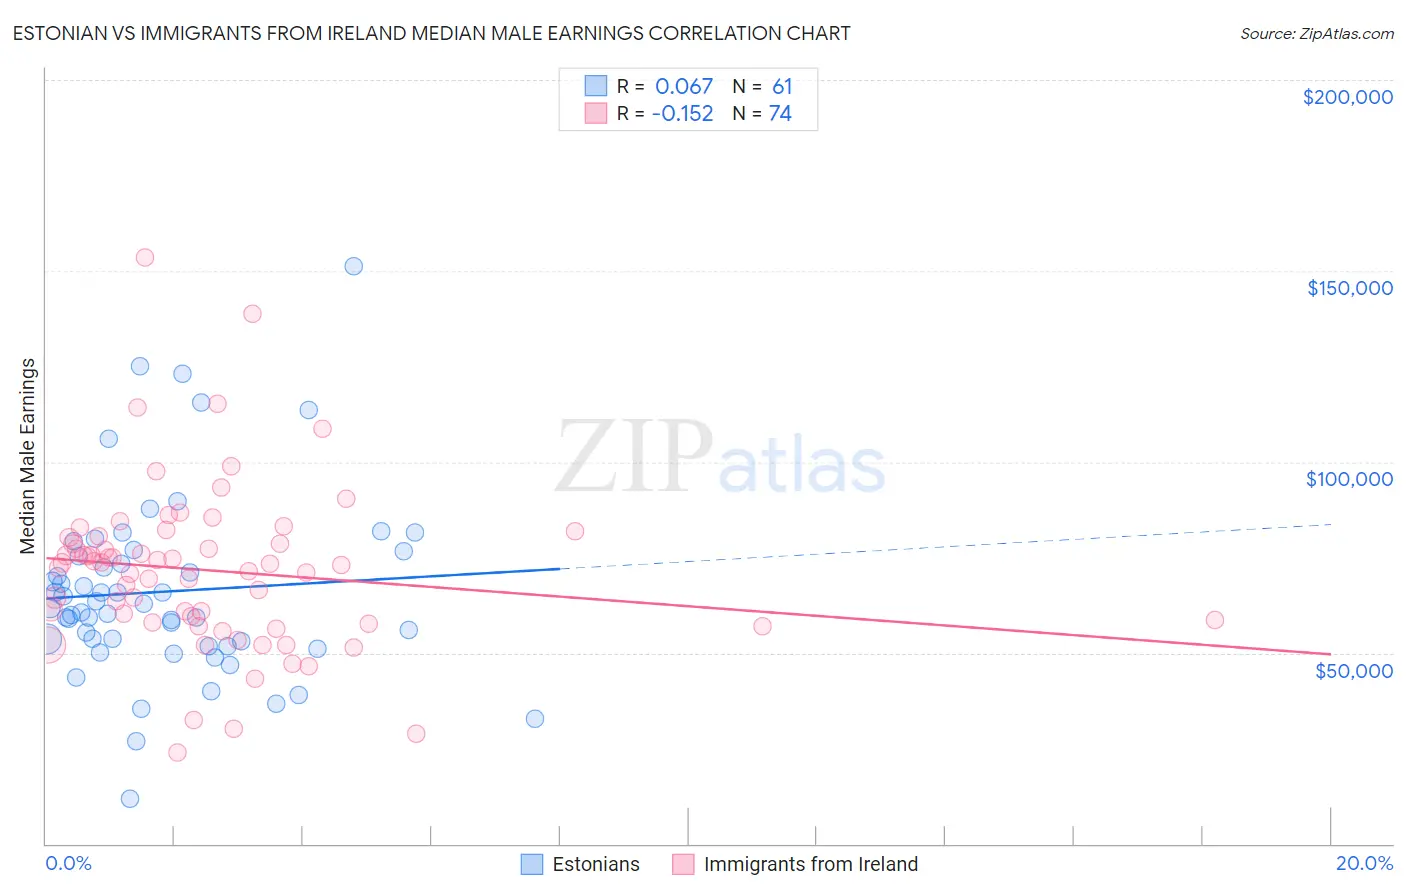
Estonian vs Immigrants from Ireland Median Male Earnings Correlation Chart
The statistical analysis conducted on geographies consisting of 123,512,238 people shows a slight positive correlation between the proportion of Estonians and median male earnings in the United States with a correlation coefficient (R) of 0.067 and weighted average of $61,710. Similarly, the statistical analysis conducted on geographies consisting of 240,726,887 people shows a poor negative correlation between the proportion of Immigrants from Ireland and median male earnings in the United States with a correlation coefficient (R) of -0.152 and weighted average of $67,698, a difference of 9.7%.
Median Male Earnings Correlation Summary
| Measurement | Estonian | Immigrants from Ireland |
| Minimum | $11,700 | $23,924 |
| Maximum | $151,311 | $153,576 |
| Range | $139,611 | $129,652 |
| Mean | $66,018 | $71,558 |
| Median | $61,673 | $73,213 |
| Interquartile 25% (IQ1) | $52,472 | $58,076 |
| Interquartile 75% (IQ3) | $76,012 | $80,238 |
| Interquartile Range (IQR) | $23,541 | $22,162 |
| Standard Deviation (Sample) | $24,287 | $21,669 |
| Standard Deviation (Population) | $24,087 | $21,523 |
Similar Demographics by Median Male Earnings
Demographics Similar to Estonians by Median Male Earnings
In terms of median male earnings, the demographic groups most similar to Estonians are Bhutanese ($61,759, a difference of 0.080%), Immigrants from Norway ($61,628, a difference of 0.13%), South African ($61,460, a difference of 0.41%), Immigrants from Latvia ($61,422, a difference of 0.47%), and Immigrants from Europe ($62,057, a difference of 0.56%).
| Demographics | Rating | Rank | Median Male Earnings |
| Cambodians | 100.0 /100 | #44 | Exceptional $62,516 |
| Bulgarians | 100.0 /100 | #45 | Exceptional $62,378 |
| Immigrants | Czechoslovakia | 99.9 /100 | #46 | Exceptional $62,217 |
| Immigrants | Austria | 99.9 /100 | #47 | Exceptional $62,164 |
| Immigrants | Malaysia | 99.9 /100 | #48 | Exceptional $62,121 |
| Immigrants | Europe | 99.9 /100 | #49 | Exceptional $62,057 |
| Bhutanese | 99.9 /100 | #50 | Exceptional $61,759 |
| Estonians | 99.9 /100 | #51 | Exceptional $61,710 |
| Immigrants | Norway | 99.9 /100 | #52 | Exceptional $61,628 |
| South Africans | 99.9 /100 | #53 | Exceptional $61,460 |
| Immigrants | Latvia | 99.9 /100 | #54 | Exceptional $61,422 |
| Greeks | 99.9 /100 | #55 | Exceptional $61,242 |
| Lithuanians | 99.9 /100 | #56 | Exceptional $61,228 |
| Immigrants | Scotland | 99.9 /100 | #57 | Exceptional $61,220 |
| New Zealanders | 99.9 /100 | #58 | Exceptional $61,199 |
Demographics Similar to Immigrants from Ireland by Median Male Earnings
In terms of median male earnings, the demographic groups most similar to Immigrants from Ireland are Immigrants from Australia ($67,634, a difference of 0.090%), Immigrants from China ($67,353, a difference of 0.51%), Okinawan ($67,232, a difference of 0.69%), Immigrants from Eastern Asia ($66,903, a difference of 1.2%), and Immigrants from Israel ($68,716, a difference of 1.5%).
| Demographics | Rating | Rank | Median Male Earnings |
| Thais | 100.0 /100 | #4 | Exceptional $72,135 |
| Immigrants | Singapore | 100.0 /100 | #5 | Exceptional $71,348 |
| Iranians | 100.0 /100 | #6 | Exceptional $70,648 |
| Immigrants | Hong Kong | 100.0 /100 | #7 | Exceptional $70,146 |
| Immigrants | Iran | 100.0 /100 | #8 | Exceptional $69,284 |
| Immigrants | South Central Asia | 100.0 /100 | #9 | Exceptional $68,960 |
| Immigrants | Israel | 100.0 /100 | #10 | Exceptional $68,716 |
| Immigrants | Ireland | 100.0 /100 | #11 | Exceptional $67,698 |
| Immigrants | Australia | 100.0 /100 | #12 | Exceptional $67,634 |
| Immigrants | China | 100.0 /100 | #13 | Exceptional $67,353 |
| Okinawans | 100.0 /100 | #14 | Exceptional $67,232 |
| Immigrants | Eastern Asia | 100.0 /100 | #15 | Exceptional $66,903 |
| Eastern Europeans | 100.0 /100 | #16 | Exceptional $66,472 |
| Immigrants | Belgium | 100.0 /100 | #17 | Exceptional $66,125 |
| Indians (Asian) | 100.0 /100 | #18 | Exceptional $66,078 |