Estonian vs Immigrants from Senegal Median Male Earnings
COMPARE
Estonian
Immigrants from Senegal
Median Male Earnings
Median Male Earnings Comparison
Estonians
Immigrants from Senegal
$61,710
MEDIAN MALE EARNINGS
99.9/ 100
METRIC RATING
51st/ 347
METRIC RANK
$51,647
MEDIAN MALE EARNINGS
5.8/ 100
METRIC RATING
221st/ 347
METRIC RANK
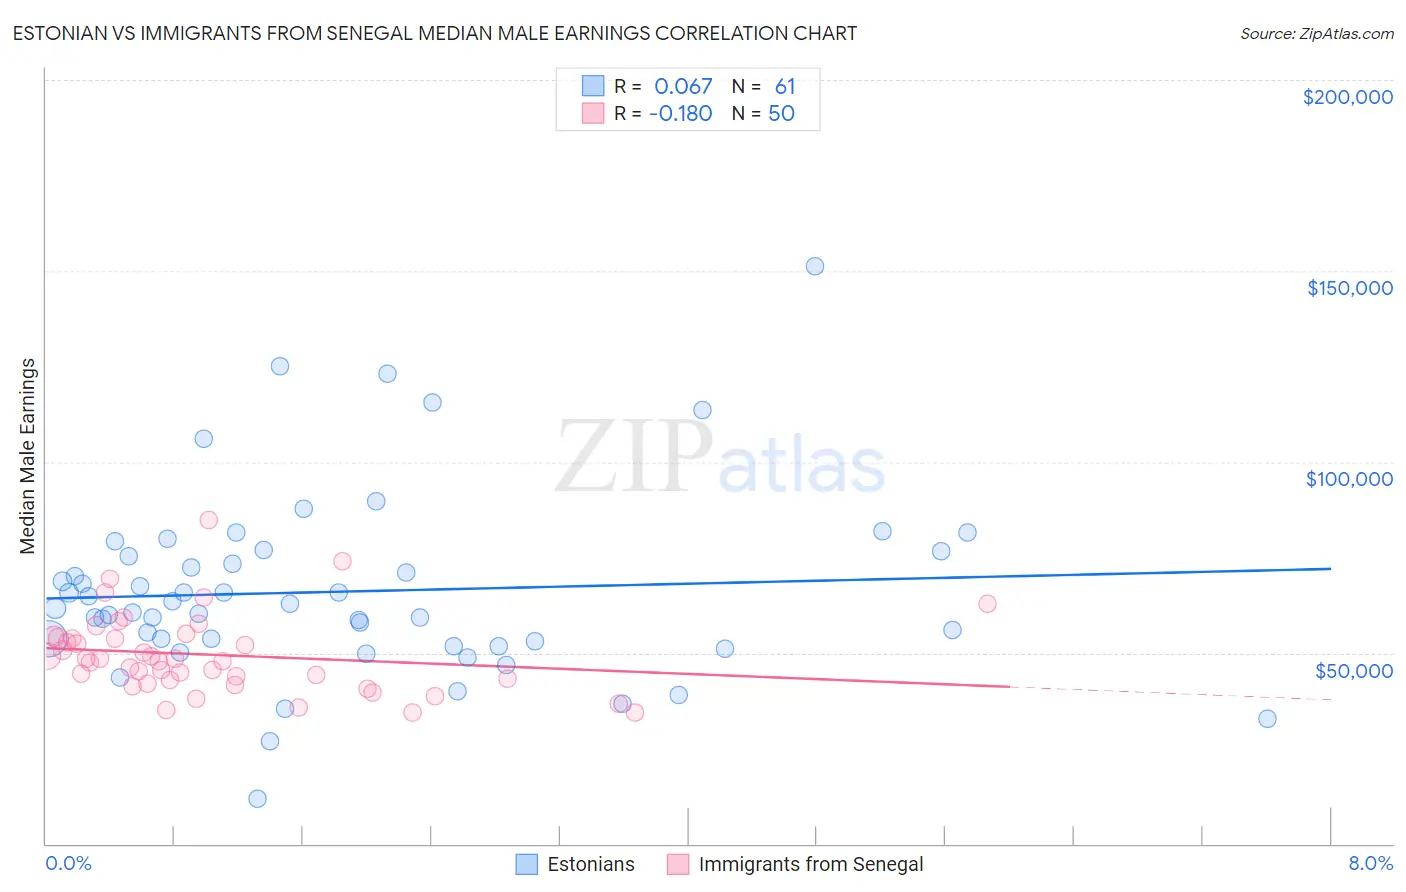
Estonian vs Immigrants from Senegal Median Male Earnings Correlation Chart
The statistical analysis conducted on geographies consisting of 123,512,238 people shows a slight positive correlation between the proportion of Estonians and median male earnings in the United States with a correlation coefficient (R) of 0.067 and weighted average of $61,710. Similarly, the statistical analysis conducted on geographies consisting of 90,120,313 people shows a poor negative correlation between the proportion of Immigrants from Senegal and median male earnings in the United States with a correlation coefficient (R) of -0.180 and weighted average of $51,647, a difference of 19.5%.
Median Male Earnings Correlation Summary
| Measurement | Estonian | Immigrants from Senegal |
| Minimum | $11,700 | $34,387 |
| Maximum | $151,311 | $84,866 |
| Range | $139,611 | $50,479 |
| Mean | $66,018 | $49,446 |
| Median | $61,673 | $48,099 |
| Interquartile 25% (IQ1) | $52,472 | $42,790 |
| Interquartile 75% (IQ3) | $76,012 | $53,838 |
| Interquartile Range (IQR) | $23,541 | $11,049 |
| Standard Deviation (Sample) | $24,287 | $10,360 |
| Standard Deviation (Population) | $24,087 | $10,256 |
Similar Demographics by Median Male Earnings
Demographics Similar to Estonians by Median Male Earnings
In terms of median male earnings, the demographic groups most similar to Estonians are Bhutanese ($61,759, a difference of 0.080%), Immigrants from Norway ($61,628, a difference of 0.13%), South African ($61,460, a difference of 0.41%), Immigrants from Latvia ($61,422, a difference of 0.47%), and Immigrants from Europe ($62,057, a difference of 0.56%).
| Demographics | Rating | Rank | Median Male Earnings |
| Cambodians | 100.0 /100 | #44 | Exceptional $62,516 |
| Bulgarians | 100.0 /100 | #45 | Exceptional $62,378 |
| Immigrants | Czechoslovakia | 99.9 /100 | #46 | Exceptional $62,217 |
| Immigrants | Austria | 99.9 /100 | #47 | Exceptional $62,164 |
| Immigrants | Malaysia | 99.9 /100 | #48 | Exceptional $62,121 |
| Immigrants | Europe | 99.9 /100 | #49 | Exceptional $62,057 |
| Bhutanese | 99.9 /100 | #50 | Exceptional $61,759 |
| Estonians | 99.9 /100 | #51 | Exceptional $61,710 |
| Immigrants | Norway | 99.9 /100 | #52 | Exceptional $61,628 |
| South Africans | 99.9 /100 | #53 | Exceptional $61,460 |
| Immigrants | Latvia | 99.9 /100 | #54 | Exceptional $61,422 |
| Greeks | 99.9 /100 | #55 | Exceptional $61,242 |
| Lithuanians | 99.9 /100 | #56 | Exceptional $61,228 |
| Immigrants | Scotland | 99.9 /100 | #57 | Exceptional $61,220 |
| New Zealanders | 99.9 /100 | #58 | Exceptional $61,199 |
Demographics Similar to Immigrants from Senegal by Median Male Earnings
In terms of median male earnings, the demographic groups most similar to Immigrants from Senegal are Immigrants from Bangladesh ($51,642, a difference of 0.010%), Ecuadorian ($51,596, a difference of 0.10%), Immigrants from Cambodia ($51,594, a difference of 0.10%), Immigrants from Armenia ($51,793, a difference of 0.28%), and Immigrants from Sudan ($51,489, a difference of 0.31%).
| Demographics | Rating | Rank | Median Male Earnings |
| Immigrants | Nonimmigrants | 9.3 /100 | #214 | Tragic $52,170 |
| Immigrants | Cameroon | 8.9 /100 | #215 | Tragic $52,119 |
| Immigrants | Venezuela | 8.3 /100 | #216 | Tragic $52,041 |
| Nigerians | 8.3 /100 | #217 | Tragic $52,039 |
| Immigrants | Panama | 7.7 /100 | #218 | Tragic $51,962 |
| Immigrants | Ghana | 6.9 /100 | #219 | Tragic $51,836 |
| Immigrants | Armenia | 6.6 /100 | #220 | Tragic $51,793 |
| Immigrants | Senegal | 5.8 /100 | #221 | Tragic $51,647 |
| Immigrants | Bangladesh | 5.8 /100 | #222 | Tragic $51,642 |
| Ecuadorians | 5.5 /100 | #223 | Tragic $51,596 |
| Immigrants | Cambodia | 5.5 /100 | #224 | Tragic $51,594 |
| Immigrants | Sudan | 5.0 /100 | #225 | Tragic $51,489 |
| Japanese | 4.9 /100 | #226 | Tragic $51,473 |
| Trinidadians and Tobagonians | 4.8 /100 | #227 | Tragic $51,446 |
| Samoans | 4.6 /100 | #228 | Tragic $51,389 |