Okinawan vs Soviet Union Median Male Earnings
COMPARE
Okinawan
Soviet Union
Median Male Earnings
Median Male Earnings Comparison
Okinawans
Soviet Union
$67,232
MEDIAN MALE EARNINGS
100.0/ 100
METRIC RATING
14th/ 347
METRIC RANK
$63,382
MEDIAN MALE EARNINGS
100.0/ 100
METRIC RATING
32nd/ 347
METRIC RANK
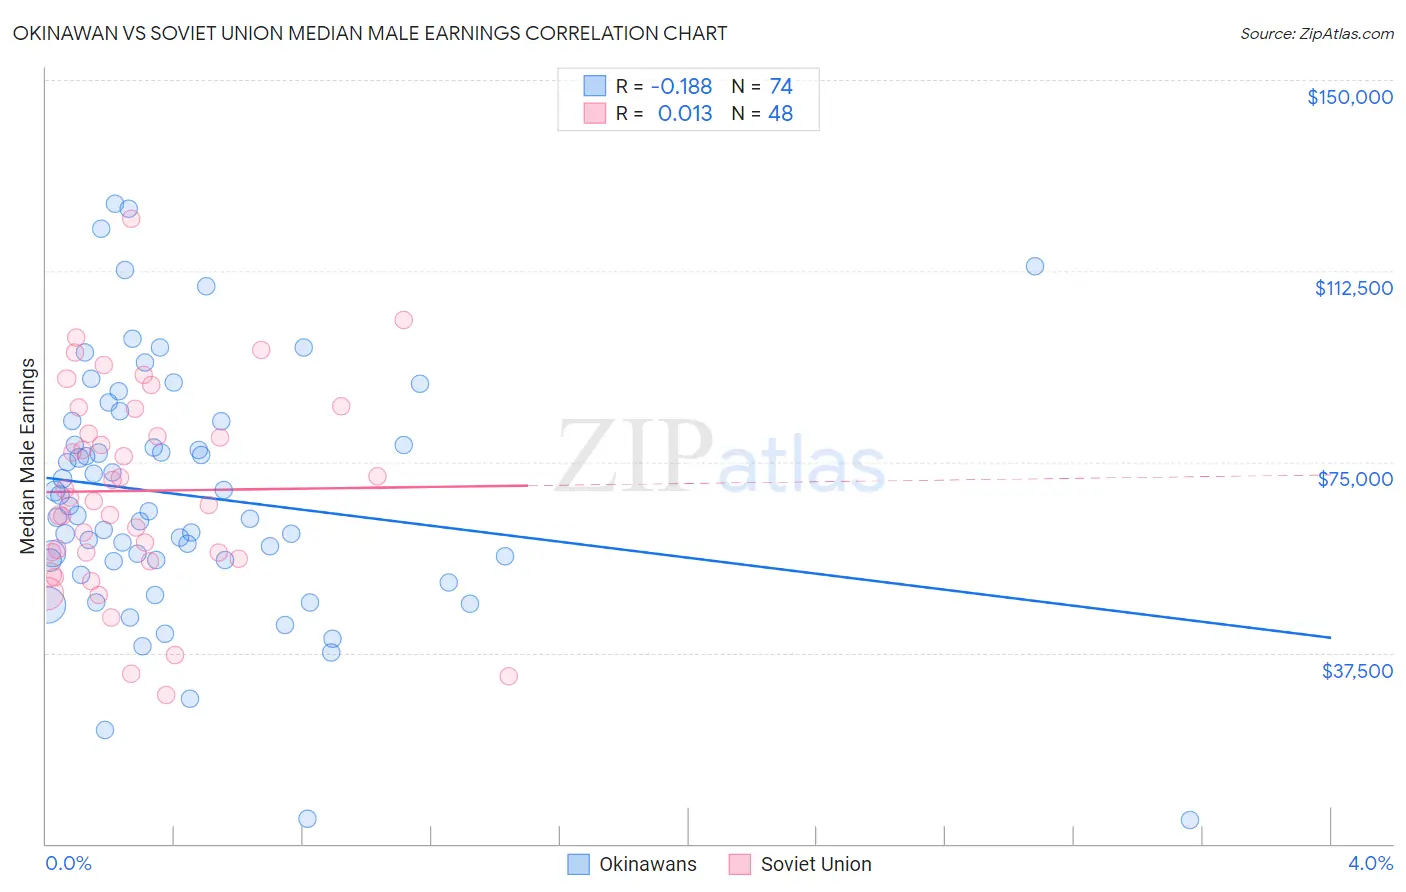
Okinawan vs Soviet Union Median Male Earnings Correlation Chart
The statistical analysis conducted on geographies consisting of 73,732,782 people shows a poor negative correlation between the proportion of Okinawans and median male earnings in the United States with a correlation coefficient (R) of -0.188 and weighted average of $67,232. Similarly, the statistical analysis conducted on geographies consisting of 43,507,869 people shows no correlation between the proportion of Soviet Union and median male earnings in the United States with a correlation coefficient (R) of 0.013 and weighted average of $63,382, a difference of 6.1%.
Median Male Earnings Correlation Summary
| Measurement | Okinawan | Soviet Union |
| Minimum | $4,698 | $29,197 |
| Maximum | $125,733 | $122,813 |
| Range | $121,035 | $93,616 |
| Mean | $68,280 | $69,321 |
| Median | $64,869 | $67,564 |
| Interquartile 25% (IQ1) | $55,642 | $56,498 |
| Interquartile 75% (IQ3) | $83,017 | $82,953 |
| Interquartile Range (IQR) | $27,375 | $26,455 |
| Standard Deviation (Sample) | $24,436 | $19,957 |
| Standard Deviation (Population) | $24,270 | $19,748 |
Demographics Similar to Okinawans and Soviet Union by Median Male Earnings
In terms of median male earnings, the demographic groups most similar to Okinawans are Immigrants from China ($67,353, a difference of 0.18%), Immigrants from Eastern Asia ($66,903, a difference of 0.49%), Eastern European ($66,472, a difference of 1.1%), Immigrants from Belgium ($66,125, a difference of 1.7%), and Indian (Asian) ($66,078, a difference of 1.8%). Similarly, the demographic groups most similar to Soviet Union are Immigrants from Lithuania ($63,346, a difference of 0.060%), Latvian ($63,498, a difference of 0.18%), Immigrants from France ($63,715, a difference of 0.53%), Asian ($63,827, a difference of 0.70%), and Russian ($63,939, a difference of 0.88%).
| Demographics | Rating | Rank | Median Male Earnings |
| Immigrants | China | 100.0 /100 | #13 | Exceptional $67,353 |
| Okinawans | 100.0 /100 | #14 | Exceptional $67,232 |
| Immigrants | Eastern Asia | 100.0 /100 | #15 | Exceptional $66,903 |
| Eastern Europeans | 100.0 /100 | #16 | Exceptional $66,472 |
| Immigrants | Belgium | 100.0 /100 | #17 | Exceptional $66,125 |
| Indians (Asian) | 100.0 /100 | #18 | Exceptional $66,078 |
| Cypriots | 100.0 /100 | #19 | Exceptional $65,549 |
| Immigrants | Japan | 100.0 /100 | #20 | Exceptional $65,518 |
| Immigrants | Sweden | 100.0 /100 | #21 | Exceptional $65,406 |
| Burmese | 100.0 /100 | #22 | Exceptional $65,236 |
| Immigrants | Korea | 100.0 /100 | #23 | Exceptional $65,079 |
| Immigrants | Northern Europe | 100.0 /100 | #24 | Exceptional $64,987 |
| Immigrants | Denmark | 100.0 /100 | #25 | Exceptional $64,625 |
| Turks | 100.0 /100 | #26 | Exceptional $64,253 |
| Immigrants | Switzerland | 100.0 /100 | #27 | Exceptional $63,944 |
| Russians | 100.0 /100 | #28 | Exceptional $63,939 |
| Asians | 100.0 /100 | #29 | Exceptional $63,827 |
| Immigrants | France | 100.0 /100 | #30 | Exceptional $63,715 |
| Latvians | 100.0 /100 | #31 | Exceptional $63,498 |
| Soviet Union | 100.0 /100 | #32 | Exceptional $63,382 |
| Immigrants | Lithuania | 100.0 /100 | #33 | Exceptional $63,346 |