Turkish vs Soviet Union Median Male Earnings
COMPARE
Turkish
Soviet Union
Median Male Earnings
Median Male Earnings Comparison
Turks
Soviet Union
$64,253
MEDIAN MALE EARNINGS
100.0/ 100
METRIC RATING
26th/ 347
METRIC RANK
$63,382
MEDIAN MALE EARNINGS
100.0/ 100
METRIC RATING
32nd/ 347
METRIC RANK
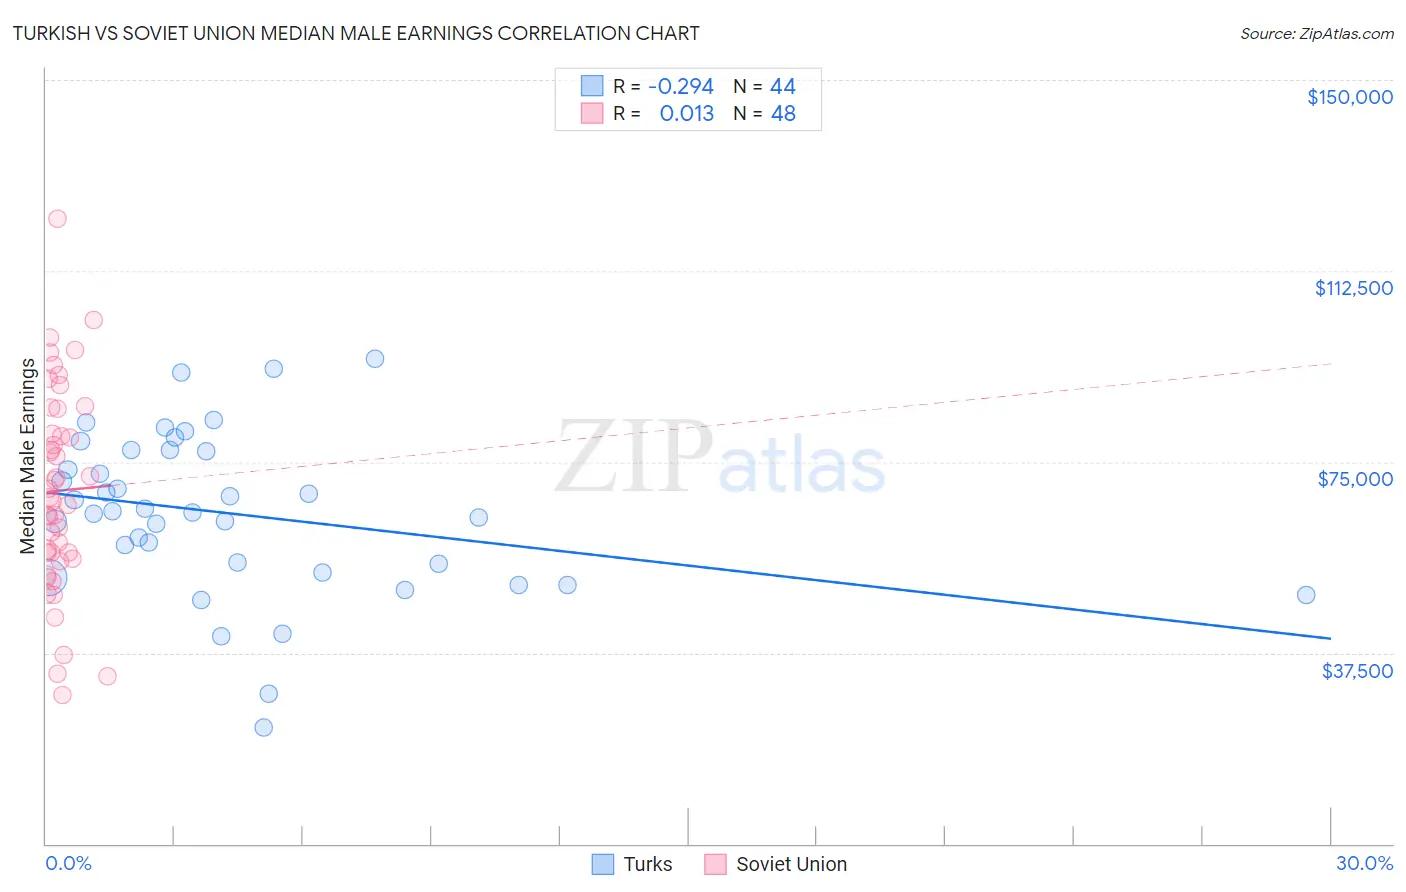
Turkish vs Soviet Union Median Male Earnings Correlation Chart
The statistical analysis conducted on geographies consisting of 271,821,901 people shows a weak negative correlation between the proportion of Turks and median male earnings in the United States with a correlation coefficient (R) of -0.294 and weighted average of $64,253. Similarly, the statistical analysis conducted on geographies consisting of 43,507,869 people shows no correlation between the proportion of Soviet Union and median male earnings in the United States with a correlation coefficient (R) of 0.013 and weighted average of $63,382, a difference of 1.4%.
Median Male Earnings Correlation Summary
| Measurement | Turkish | Soviet Union |
| Minimum | $22,917 | $29,197 |
| Maximum | $95,313 | $122,813 |
| Range | $72,396 | $93,616 |
| Mean | $64,813 | $69,321 |
| Median | $65,160 | $67,564 |
| Interquartile 25% (IQ1) | $54,093 | $56,498 |
| Interquartile 75% (IQ3) | $77,144 | $82,953 |
| Interquartile Range (IQR) | $23,051 | $26,455 |
| Standard Deviation (Sample) | $15,821 | $19,957 |
| Standard Deviation (Population) | $15,640 | $19,748 |
Demographics Similar to Turks and Soviet Union by Median Male Earnings
In terms of median male earnings, the demographic groups most similar to Turks are Immigrants from Switzerland ($63,944, a difference of 0.48%), Russian ($63,939, a difference of 0.49%), Immigrants from Denmark ($64,625, a difference of 0.58%), Asian ($63,827, a difference of 0.67%), and Immigrants from France ($63,715, a difference of 0.84%). Similarly, the demographic groups most similar to Soviet Union are Immigrants from Lithuania ($63,346, a difference of 0.060%), Immigrants from Russia ($63,326, a difference of 0.090%), Latvian ($63,498, a difference of 0.18%), Immigrants from Asia ($63,240, a difference of 0.22%), and Israeli ($63,228, a difference of 0.24%).
| Demographics | Rating | Rank | Median Male Earnings |
| Cypriots | 100.0 /100 | #19 | Exceptional $65,549 |
| Immigrants | Japan | 100.0 /100 | #20 | Exceptional $65,518 |
| Immigrants | Sweden | 100.0 /100 | #21 | Exceptional $65,406 |
| Burmese | 100.0 /100 | #22 | Exceptional $65,236 |
| Immigrants | Korea | 100.0 /100 | #23 | Exceptional $65,079 |
| Immigrants | Northern Europe | 100.0 /100 | #24 | Exceptional $64,987 |
| Immigrants | Denmark | 100.0 /100 | #25 | Exceptional $64,625 |
| Turks | 100.0 /100 | #26 | Exceptional $64,253 |
| Immigrants | Switzerland | 100.0 /100 | #27 | Exceptional $63,944 |
| Russians | 100.0 /100 | #28 | Exceptional $63,939 |
| Asians | 100.0 /100 | #29 | Exceptional $63,827 |
| Immigrants | France | 100.0 /100 | #30 | Exceptional $63,715 |
| Latvians | 100.0 /100 | #31 | Exceptional $63,498 |
| Soviet Union | 100.0 /100 | #32 | Exceptional $63,382 |
| Immigrants | Lithuania | 100.0 /100 | #33 | Exceptional $63,346 |
| Immigrants | Russia | 100.0 /100 | #34 | Exceptional $63,326 |
| Immigrants | Asia | 100.0 /100 | #35 | Exceptional $63,240 |
| Israelis | 100.0 /100 | #36 | Exceptional $63,228 |
| Immigrants | Sri Lanka | 100.0 /100 | #37 | Exceptional $63,099 |
| Maltese | 100.0 /100 | #38 | Exceptional $62,953 |
| Immigrants | South Africa | 100.0 /100 | #39 | Exceptional $62,899 |